


[ad_1]
When Census released May construction spending data on July 3 they also revised spending for all markets for the last 2 years. Largest revisions are usually in previous year. This changes % growth and baseline for the start of 2023.
Census added $50 bil to 2022, $27 bil to 2021 and $6 bil to Jan-Apr 2023. Largest revs 2022, Rsdn +$17bil, Mnfg +$7bil, Comm/Rtl +$6bil, HiWay +$4bil. Largest revs 1st 4 mo (JFMA) 2023, Rsdn +$6bil, Mnfg +$2bil. 2023 Forecast$ went up, but % increase went down, because 2022 $ revs went up by more.
Residential Construction Spending Since Nov, Rsdn spending has seesawed up/down in a range from $840bil to $880bil. Currently at the high for the year. Will move slightly higher, but falls from peak in Q3. 2023 is currently down ytd 10%, will finish the year down 7%.
Construction JOBS continue to creep higher. From Apr’22 to Oct’22 jobs increased 1.5% but volume of work dropped 10%. Jobs and volume should track together as seen from 2011 to 2018. Since Oct’22, jobs up only 2% while volume up 7%. Volume catching up.
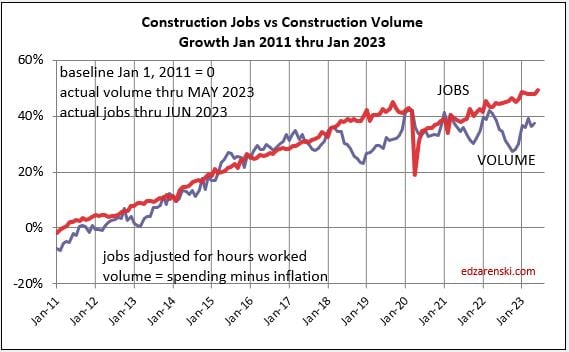
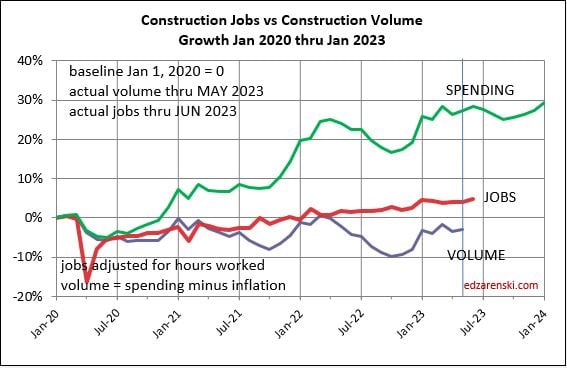
Construction spending is up/dn thru year end, ending the year about where it is now. But by year-end, after taking out inflation, volume will be down 2%. In last 3 yrs, jobs seldom drop along with volume. I think jobs will not track volume down 2%, but finish 2023 about where they are now.
More to come.