


[ad_1]
Construction Job Openings – Behind the Headlines
Recent data indicates ~ 300k job openings. Let’s look at support. To support those openings, there must be an equivalent added volume of work.
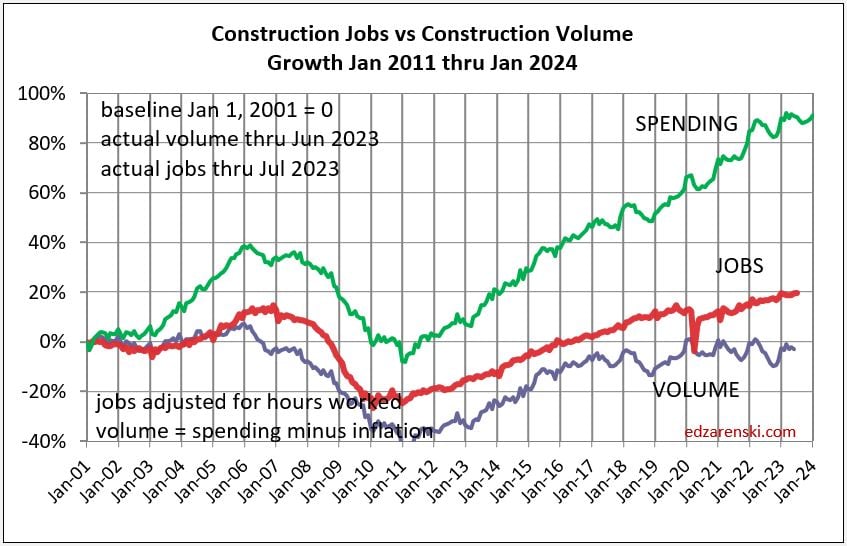
As we entered 2020, construction spending (in current $) was at a (then) all-time high of $1.530 trillion(t). Let’s set that point in time as the base and track growth since. Construction spending peaked in March 2023 at $1.970t and is currently at about $1.950t.
Volume growth in constant $ (constant $ = spending minus inflation) fell from $1.530t to $1.350t in Oct’22, has since returned to $1.450t as of June. So real volume growth is up off the bottom, but is still $80t or 5% below 2020. It is forecast to fall $50t over the next 6 months and return to current level in mid-2024.
Jobs, as we entered 2020, stood at 7.600 million(m). Jobs rapidly fell to 6.500m but recovered most of that by Dec 2020. Jobs now stand at 7.970m, up 5% since Jan 2020.
So, let’s summarize the facts: Since Jan 2020, spending is now nearly equal, volume of work is down 5%, but jobs are up 5%. So, since Jan 2020, jobs have increased 10% in excess of volume of work to support those jobs.
By my calc, if we were to add 300k jobs, either today or over the next year, we would see jobs increase by another 4%. Jobs growth since Jan’20 would exceed volume growth by nearly 14%. You might argue that 300k openings are there to fill the void of jobs supporting the current workload, but jobs growth already exceeds volume growth by 10% in the last 3 years.
Anyone want to try to explain how job openings of 300k is supported by the data?
Note 1: Job openings as of July are closer to 400,000
Note 2: plots shows baseline back to 2020 and 2001. Baseline 2001 situation becomes worse. See prior post https://edzarenski.com/2023/08/05/midyear-23-jobs-outlook/ for plots to baeline 2011 and 2020.