


[ad_1]
Construction spending 2024 through July is still on track to finish the year up 7.7%. Residential is forecast up 8.5%, Nonresidential Buildings up 6.0% and Non-building up 8.9%.
We still have 3 or 4 more months of slightly declining construction spending, driven mostly by residential, but also by Manufacturing. This is not a long term trend. Sit tight. Oct or Nov, trend tuns back up. You can see the dip in this Current $ spending plot.
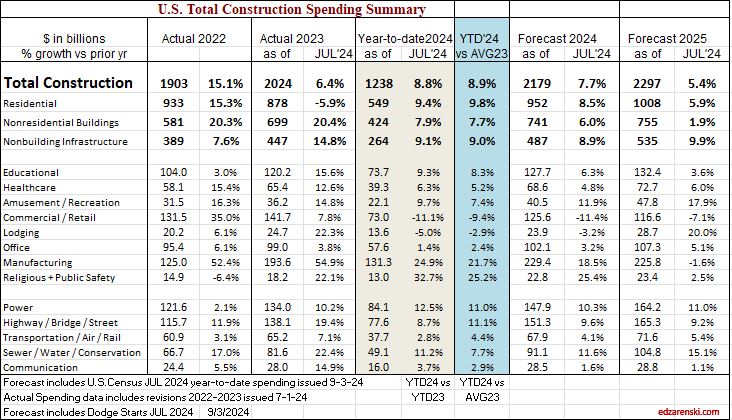
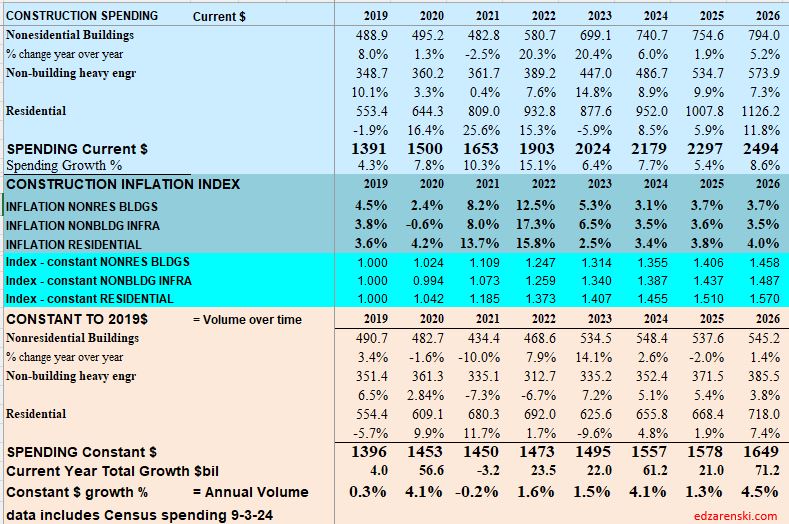
Construction spending total for 2024 expected up 7.7%. With inflation at a 4yr low (3%-4%), the amount of spending that is real volume growth is up this year, highest since 2016. It just edge out 2020.
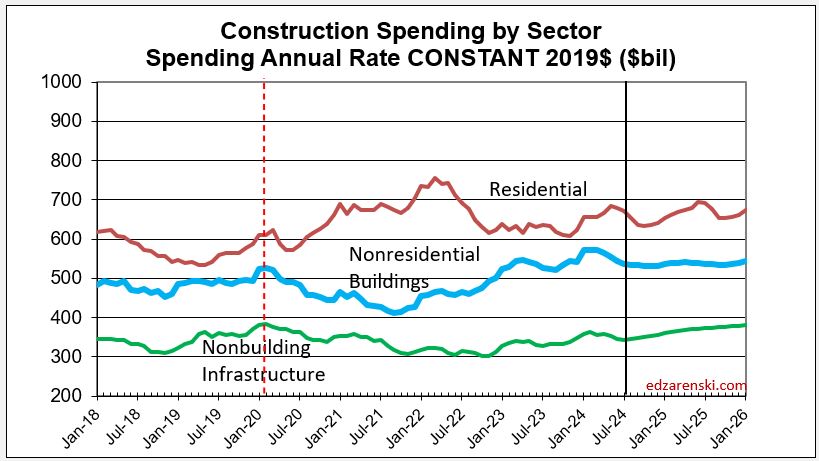
I’m forecasting residential construction spending total for 2024 at $952b ,+8.5%. But three other indicators I calculate to compare to my forecast are telling me it could come in between $960b and $970b. I’m leaning towards higher, but I’d like to see Aug data, and Sept data.
And then there’s this. Census SAAR avg YTD (the average of the reported rsdn monthly SAAR for the 1st 7 months) is $939b. My YTD SAAR avg is $964b. Some down months will lower that slightly by year-end. .
Statistically, YTD spending through July for Rsdn and Nonres Bldgs is 57% of the total annual $ spent. This is indicating year-end total $ for residential will be $963b and $744b for Nonres Bldgs.
More to come.