

[ad_1]
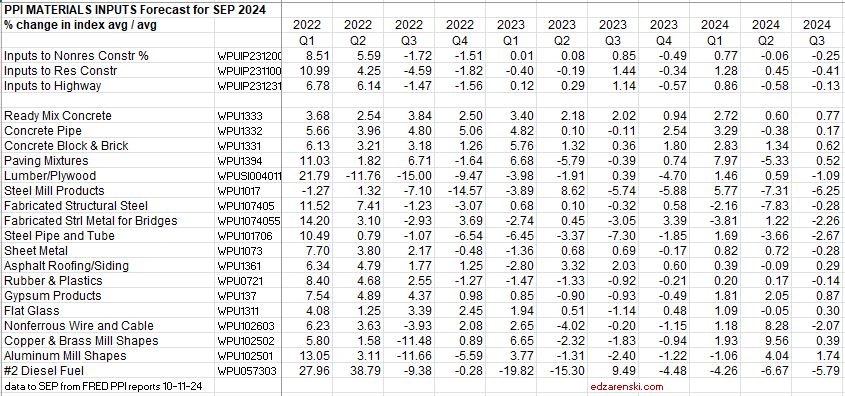
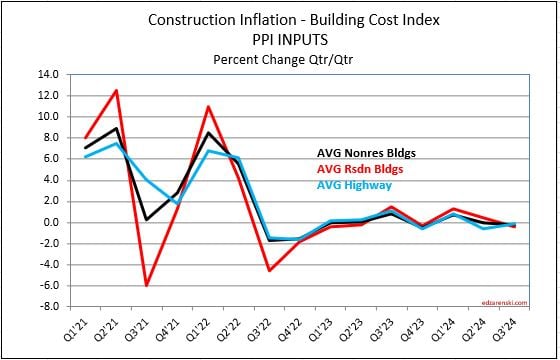
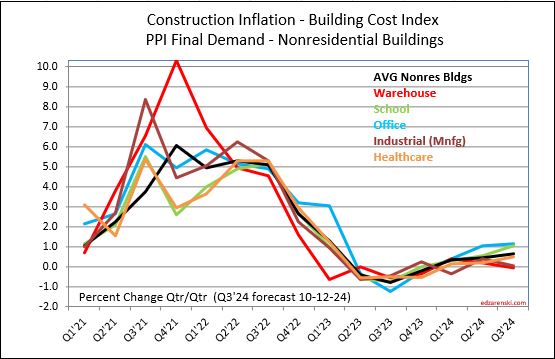
Once again, the Producer Price Index for construction materials is pretty tame with the release of the September data. For Q3, inputs to all types of construction post less than 1% growth for the quarter. This is now 6 or 7 quarters in which Inputs and Final Demand has been near 1% or lower.
Inputs year-to-date vs the 2023 average are up 1.9% for residential and up less than 1% for Nonresidential and Highway.
Individually, a few material inputs had notable moves in September: Lumber/Plywood up 1.1%, Steel Mill Products down 1.2%, Steel Pipe and Tube down 1.3%, Copper and Brass Shapes down 1.1% and Diesel down 14%.
Year-to-date, various concrete items are up 5% to 6%, Steel items are down 6% to 7%, Copper and Brass Shapes are up 6% and Diesel is down 13%.
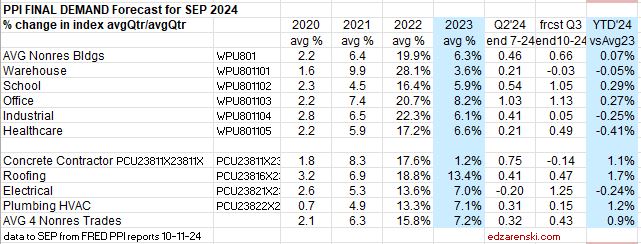
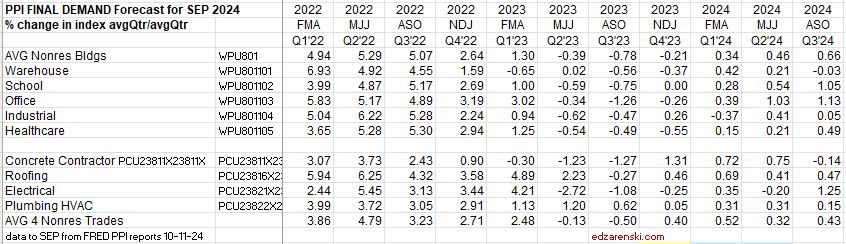
Final Demand indices for 2024 are barely moving. Although Office and School are both up over 1% for Q3, no building type is up even a half percent when compared to the average of 202. Roofing Trades are up 1.7% YTD. The average YTD for the four trades is up less than 1%. Over the last six months The only Final Demand indices to move more than 2% (for the full 6mo) were Office Bldgs and Electrical Trades.