


[ad_1]
This post will be updated frequently over the next few weeks as I add each section to my Outlook.
CONSTRUCTION SPENDING
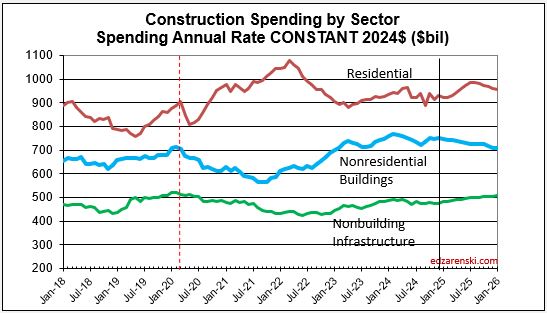
Construction spending as of Dec 2024 data is up 6.5% for 2024 vs 2023. All sectors gained between 6% and 7% over 2023. Growth is forecast at 5.3% in 2025. While Residential and Non-building Infrastructure will both gain 7%, Nonresidential Buildings will only see growth of 1.5% in 2025.
This is the first report of a full 12 months of data from 2024. This number gets revised in Mar and Apr and again in July, when any/all months for the last two years get revised.
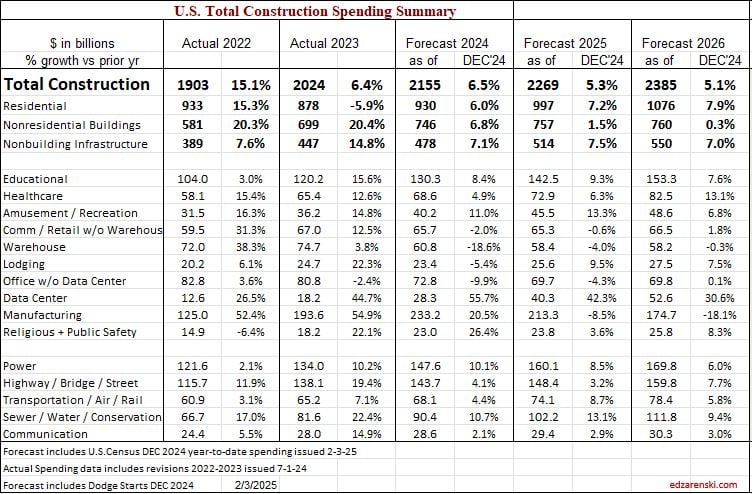
Last year at this time, leading into 2024, many of the Nonres Bldgs and Non-bldg line items showed Nov-Dec spending was already several points higher than the 2023 average. This was an indication, leading into 2024, that those markets were on track to start the year already up. This year, many markets show very small gains or a decline in the rate of spending from the 1st half of the 2024 into the 2nd half. Some notable declines are Warehouse (-2.7%), Office w/o Data Centers (-3.6%) and Highway/Bridge (-2.9%). All begin 2025 down from the average in 2024. However, Data Center spending was up 16% in Nov-Dec vs the average of 2024, so begins 2025 on a high note.
In February of 2025, with the Dec 2024 data in hand, my forecast for 2025 spending is $2,268 billion, 5.3% higher than my current 2024 forecast of $2,154 billion. There is strength in most markets, but Manufacturing is starting a downward slope in spending after three years of blockbuster performance.
My construction spending forecast for 2025 Nonres Bldgs is only an annual gain of 1.5%. Low growth is driven by projects ending in Manufacturing and Warehouse. In the last 3 yrs, there were $230bil Mnfg starts, most in 2022, $130bil above normal, now some are ending. Without Manufacturing, nonres bldgs 2025 spending would be up 6%. So while outward appearance may be that nonres spending is declining, in large part it is due to mega spending on Manufacturing buildings (and Warehouse) tapering down upon completion, creating very large annual declines, but normal. See The Manufacturing Spending Taper
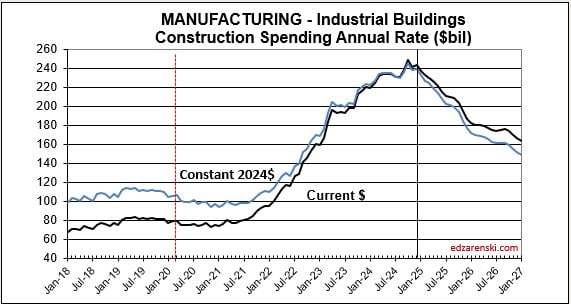
Whenever we get an unusually large increase in new construction starts and spending, the tapering off of those projects leads to a decline in spending in the 2nd half of the scheduled construction. Mnfg new starts peaked in late 2022 – early 2023, so some of these projects would now be in construction for anywhere from 24 to 30 months, well past the midpoint or peak spending. Here’s what the manufacturing spending taper may look like.
This same scenario will occur in Highway/Bridge. Normal starts have consistently been about $100bil/yr, with slow growth. But for the last three years, actual starts were closer to $500bil total for the three years. This strong growth in starts is expected to continue at least into 2025, totaling near $650bil for four years. Again, consider that part of that is inflation, but the remainder is government investment growth. So a decline from the taper back to normal for Highway/Bridge may not show up at least for the next few years. But once the taper begins it will have the same effect on Non-bldg Infrastructure spending that we will see from Manufacturing in Nonres Bldgs.
NEW CONSTRUCTION STARTS
Dodge reports, as of Dec, construction starts for 2024 are up 5.8%. Residential starts are up 6.8%. Nonresidential Buildings starts are up 4%. Non-building starts up 7%. There are some notable values behind these totals:
Data Center starts are up 500% since 2021 and are expected to increase 25% in 2025. In 2014-2015, Data Centers was less than 5% of total Office+DC construction spending. Today it is approaching 30%. Next year it will approach 40%.
Warehouse starts have dropped 16% in the last two years. Warehouse spending will now slow after climbing 100%+ since 2019. In 2015, Warehouse was 25% of total Commercial spending. By 2022 it had climbed to 54%. In 2025, it will fall back to 45%. But spending will remain near the current level at least for the next three years.
Manufacturing starts hovered near $80bil/yr from 2014 thru 2019. By 2023 new starts had increased to $200bil/yr. Starts are predicted to fall by $20bil/yr to $30bil/yr (10% to 15%) over the next three years. Spending is predicted to decline by approx. 10%/yr for the next three years.
Public Works project starts have increased 15%/yr for the last four years. Spending is up more than 50% in the last three years. Spending is predicted to climb for the next three years.
Highway/Bridge starts from 2013 to 2019 averaged near $100bil/yr. Since then, starts increased 60% and spending is up nearly 50%. Spending is predicted to climb for the next three years.
CURRENT$ / CONSTANT$
Caution: the following table, showing Constant$ analysis, now shows Constant$ with base year at 2024. Since Q1-2020 I have used the base year at 2019. This update changes the Constant$ amount, but not the Constant$ percent growth. Slight changes in prior years inflation resulted in some minor changes in Constant$ growth.
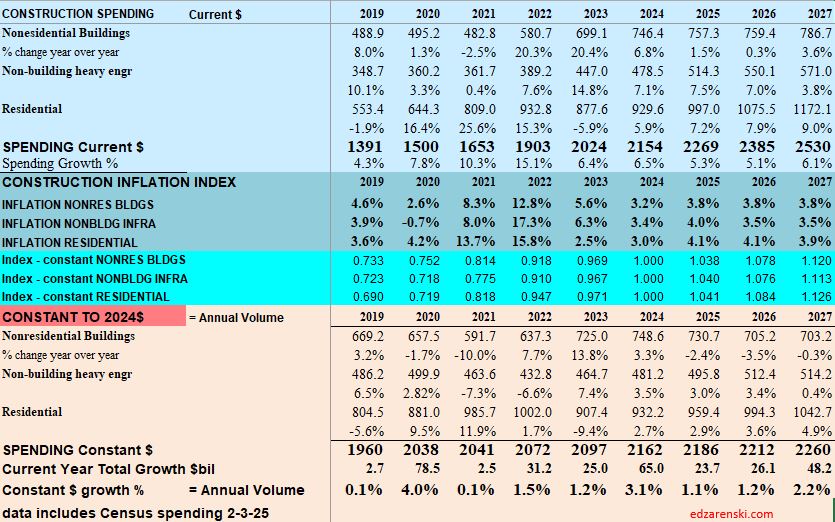
Construction spending includes inflation, which adds nothing to the volume of work put-in-place. Construction Volume is a measure of business activity. It eliminates inflation as a variable and shows Constant$ growth. As an example, 2021-22 posted some of the biggest spending increases we’ve seen in 20 years, up over 25% in two years. But, if you look at the last row in the table above, we see constant$ growth, or volume, increased only 1.6% in those two years. A glance at the inflation rates for those years confirms that almost all of the spending increases were inflation, not added business volume. Construction volume, (spending minus inflation) will finish 2024 up 3.1%, but still up only 10% since 2019.
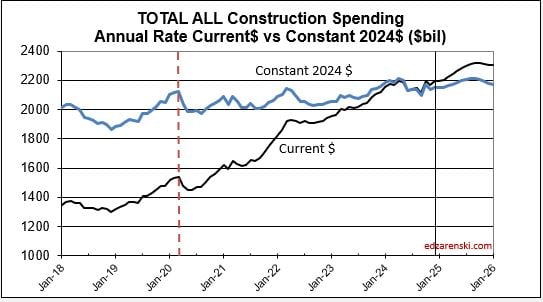
Compare this Spending by Sector plot to the Current$ plot at the beginning of this article.
CONSTRUCTION JOBS
Construction Jobs should not get compared to construction spending. Spending includes inflation, which adds nothing to business volume. Compare jobs growth to Volume growth.
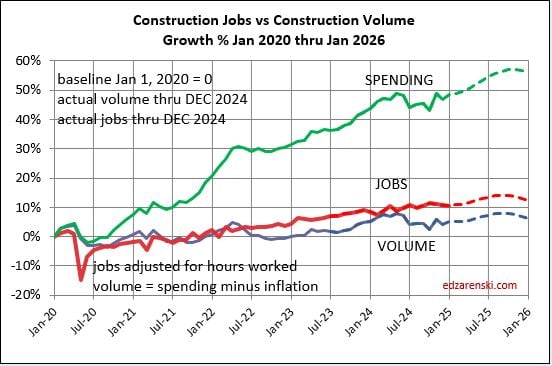
Jobs 2024 thru DEC: Rsdn+61k +1.9%, Nonres Bldgs+134k+3.7%, Nonbldg +29k+2.6%.
Construction Volume 2024 thru DEC Residential +2.7%, Nonres Bldgs +3.3%, Nonbldg +3.5%.
Don’t be surprised if 2025 construction jobs growth slows a bit. Jobs are slightly ahead of volume growth. Since 2019, both Jobs and Volume increased 10%. But that includes 2020, when volume increased 4% but jobs fell by 250k, or 3%.
Over the period of the 4 years 2021 thru 2024, Jobs increased 13%. Volume of work increased only 6%.
INFLATION
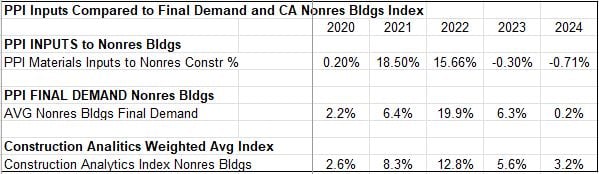
We can’t always tell what affect changes in the cost of construction materials will have on the final outcome of annual construction inflation. PPI materials index does not account for productivity or margins and varies on stage of input. A good example of stage of input is using PPI for Steel Mill Products for structural steel. That PPI does not include delivery from mill to fabricator, detailing, fabrication, shop painting, delivery to jobsite, shakeout, lifting, installation and finally overhead and profit, in all about 75% of the cost of structural steel installed.
Construction Analytics Nonres Building Cost Index is a weighted average of eight final cost indices.
NAHB estimates that $184 billion worth of goods were used in the construction of both new multifamily and single-family housing in 2023 and that $13 billon of those goods were imported. eyeonhousing.org/2024/12/impo…
This inflation analysis does not take into consideration a recession or significant new tariffs. Likewise, construction starts data may be affected and if so, also construction spending.