
Construction Analytics Economic Outlook 2024 includes Construction Data – DEC 2023 Data 2-7-24
Here is a summary of construction spending through December 2023, Inflation through 4th qtr., or Nov where available, and resulting constant dollar volume. 2023 spending will be revised three times in 2024, Mar1, Apr1 and Jul1, and then again on Jul1 2025. Historically, almost all revisions are up.
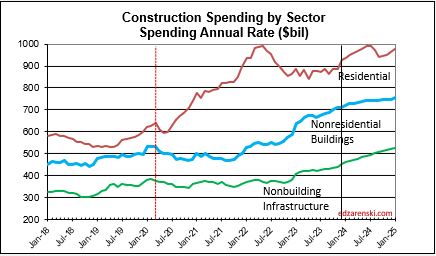
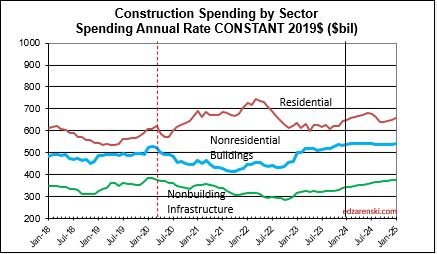
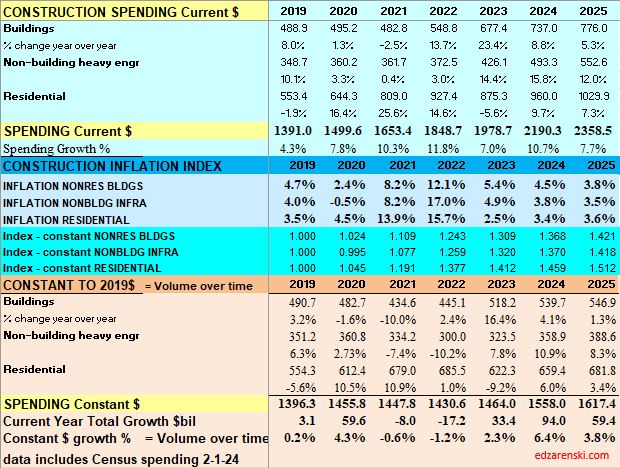
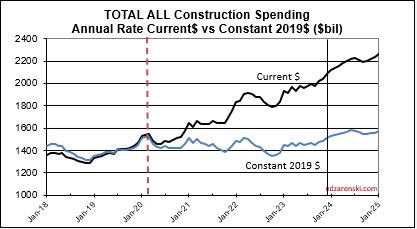
Construction spending preliminary total for 2023 is up 7.0%. But nearly 90% of that is inflation. Spending is up a total of 42% since 2019; up 8% in 2020, 10% in 2021, 12% in 2022 and now 7% in 2023. But volume after adjusting for inflation is up only 5% total. You can see the Constant$ line, with one lower dip in 2022, has ranged between Constant$1400bil. to $1500bil. since mid-2019.
Construction spending total forecast for 2024 is up 10.7%. Nonresidential Buildings is forecast up 8.8%, Non-building Infrastructure up 15.8% and Residential up 9.7%. Lower inflation in 2024 means more of that spending is counting towards real volume growth. I’m expecting only 4% to 5% inflation for 2024, so real volume growth could reach 6% for the first time since 2015. From 2012-2016, volume growth averaged 6%/yr. For the last four years, 2020-2023, 42% spending growth vs 37% inflation growth netted only 5% total real volume growth. Since 2017, volume growth averaged less than 1%/yr. Non-building Infrastructure volume could increase 10%+ in 2024.
New Construction Starts
A 50% increase in new nonresidential building starts in 2022 has a positive impact on the rate of construction spending in 2023 and 2024. It will continue to add lesser impact into 2025. In recent years, new nonres bldgs starts averaged $300 billion/year. In the 2nd half of 2022, starts averaged near $500 billion/year. For the 1st half 2023 starts dropped to a rate of $380bil. Then, for Jul-Dec 2023, starts averaged $430 billion/year. Projects starting in 2nd half of 2023 could have midpoint of construction, peak spending, in 2024 or 2025.
Residential construction (Dodge) starts posted the five highest months ever, all in the 1st 6 months of 2022. In the second half of 2022, residential starts fell 15%. In Q1 2023, residential starts dropped another 12% below 2nd half 2022, the lowest average since Q1-Q2 2020. Finally in July and August, starts regained some strength coming in 33% higher than the lows in Q1. Residential starts finish 2023 down 13% year-to-date vs 2022. Forecast is up about 10% in 2024.
Nonresidential Buildings, in 2022 posted the largest ever one-year increase in construction starts, up 50%. Some of these starts will be adding to peak spending well into 2025. Nonres Bldgs starts in the 2nd half 2022, averaged 67% higher than any other 6mo period in history. Starts fell 20% in the 1st half 2023 but still posted the 2nd highest 6mo average ever. After two years of outstanding growth, Nonres Bldgs starts close 2023 down 8%. The forecast for 2024 is +5%.
Non-building starts for the 6 month period Mar-Aug 2023 posted the best 6 months on record, up 30% from the average of 2022. The 2nd half 2022 was up 50% over 1st half 2022. For 2023, Highway/Bridge and Power have the strongest gains. Total Non-building Starts for 2023 are up 25%. Non-building starts for 2024 are forecast up 8%.
Current Rate of Spending
The current seasonally adjusted annual rate (SAAR) of spending gives an indication of how spending will perform in the following year. As we begin 2024, the current rate of spending (SAAR) for Nonresidential Buildings in Q4’23 is $709bil., already 4.5% higher than the average for 2023 ($677bil). If spending stays at the current level and no additional growth occurs, Nonresidential Bldgs spending will finish 2024 up 4.5%. Spending would need to have more monthly declines than increases to finish the year up less than 4.5%. The current forecast shows a monthly SAAR rate of growth for Nonresidential Bldgs. averaging about 0.5%/mo in 2024, so we have a minimum, but we can expect 2024 total spending to rise considerably higher than the current rate.
Non-building Infrastructure current rate of spending is now 3.7% higher than the average for 2023, however the forecast is indicating steady growth of 1%/mo for all of 2024.
Residential current rate of spending is 2.4% above the 2023 average and is forecast to average an increase of just under 1%/mo for 2024.
2024 Spending Forecast
Total Construction Spending in 2024 is forecast at $2,190 billion, an increase of 10.7% over 2023.
Nonresidential Buildings spending is forecast at $737 billion, an increase of 8.8% over 2023.
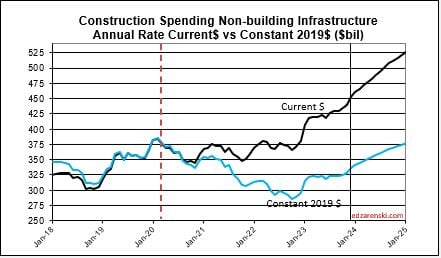
Non-building Infrastructure spending is forecast at $493 billion, an increase of 15.8% over 2023.
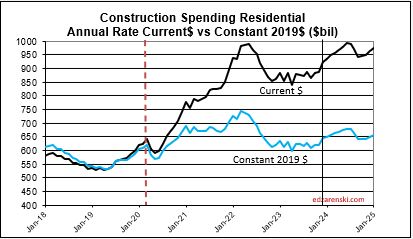
Residential Buildings spending is forecast at $960 billion, an increase of 9.7% over 2023.
This forecast does not include a recession.
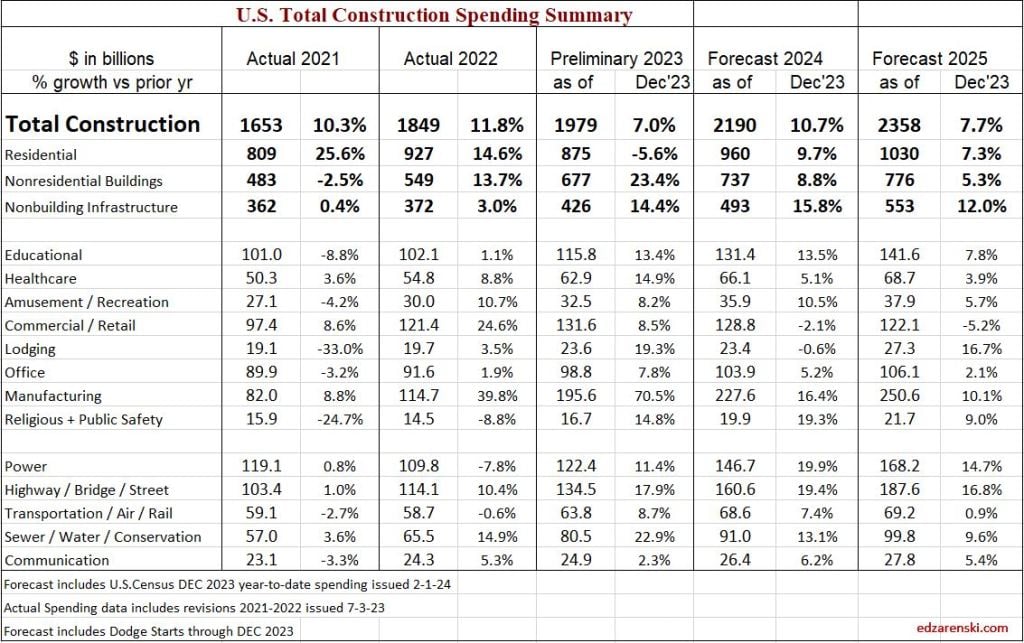
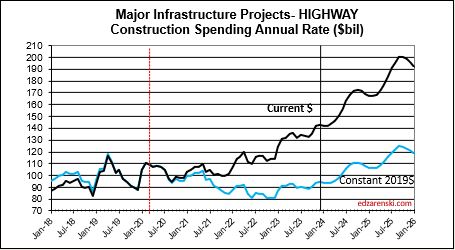
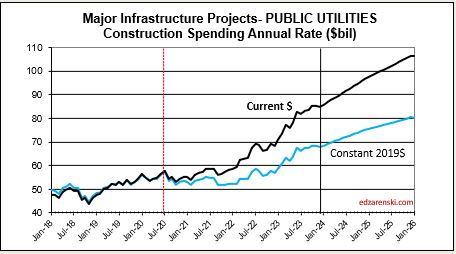
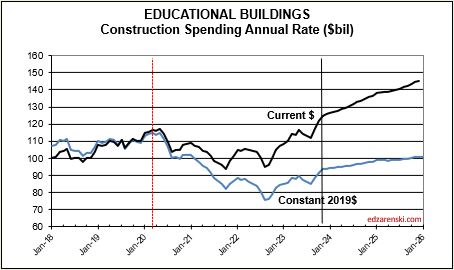
The largest increases to construction spending in 2023 are Manufacturing +$80bil, Highway +$20bil, Public Utilities (Sewage and Waste, Water Supply and Conservation-Rivers-Dams) +$15bil and Educational +$14bil.
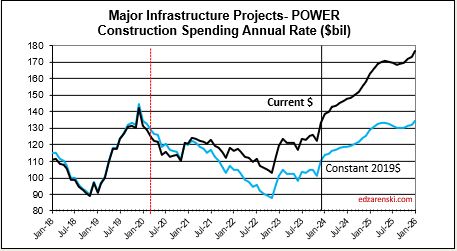
Residential regains the top growth spot in 2024 with a forecast spending increase of +$68bil. Manufacturing is forecast to add +$32bil. Highway gains +$26bil, Power +$24bil and Educational gains +$15bil.
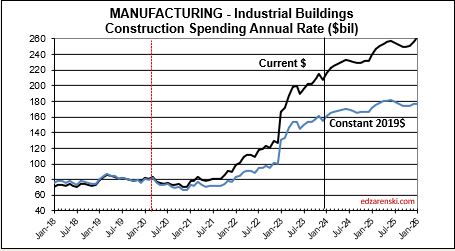
One big question is how did the forecast for Manufacturing increase so much since the beginning of 2023. Since January 2023, the starts forecast for 2023 increased by 35%. How much of that 35% is real growth in starts vs an increase in the capture rate of data gathering is yet to be determined, but has an impact of 2023-2024 spending. Also, starts for future years were increased by 50%. Starts (contract awards) drives up the spending forecast, since spending is a function of the future monthly cash flow (spending) of starts.
As we begin the year, Manufacturing SAAR current rate of spending is already 8% higher than the average for 2023. The current rate of spending is increasing at an average of near 2%/month for the next 6 months, then slows or dips slightly for the remainder of the year, indicating total spending for 2024 will finish well above the current rate of 8%. I’m forecasting 16% growth for the year.
Highway SAAR rate of spending begins the year 6.5% higher than the average for 2023, with the current rate increasing at an average of 1%/month for all of 2024, indicating total spending for 2024 will finish well above the current rate of 8%. My forecast is for 19% growth in 2024.
Power SAAR rate of spending begins the year 4% higher than the average for 2023, with the current rate increasing at an average over 1%/month for 2024, indicating total spending for 2024 will finish much higher. My forecast is for 20% growth in 2024.
Public Utilities SAAR rate of spending begins the year 6% higher than the average for 2023, with the current rate increasing at an average over 1%/month for 2024. My forecast is for 13% growth in 2024.
Residential regains the top spot in 2024 with a forecast spending increase of $68bil. Residential SAAR rate of spending in Q4’23 was up 2.5% over 2023, but December was up 5%. So we begin the year 2.5% to 5% higher than the average for 2023. The rate of spending is forecast to increase 1%/month for 6 months, then fall 0.5%/mo for H2 2024. My forecast is for 10% growth in 2024.

Educational SAAR rate of spending begins 2024 7% higher than the average for 2023, and the current rate is increasing at an average of 0.7%/month for 2024. My forecast is for 13% growth.
Current$ Spending, Inflation, Constant$ Volume
Spending includes inflation. Inflation adds nothing to the volume of work.
Inflation adjusted volume is spending minus inflation, or to be more accurate, spending divided by (1+inflation). Inflation adds nothing to volume growth. The following table shows spending, inflation and volume (spending without inflation) for each year. Spending is current to the year stated. The values in the constant table are indexed to a constant value year, 2019. This shows business volume year to year, can be a lot different than spending would indicate. When inflation is positive, volume is always less than spending by the amount attributed to inflation.
Lower inflation in 2024 means more of that spending is counting towards real volume growth. Expecting only 4% to 5% inflation for 2024, real volume growth could reach 6% for the first time since 2015. From 2012-2016, volume growth averaged 6%/yr. For the last four years, 2020-2023, 42% spending growth vs 37% inflation growth netted only 5% total real volume growth. Since 2017, volume growth averaged less than 1%/yr. Non-building Infrastructure volume could increase 10%+ in 2024.
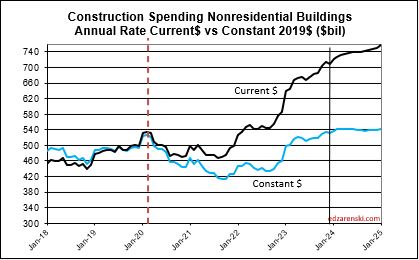
Spending during the year is the value of business volume plus the inflation on that volume. When inflation is 12%, volume plus 12% = total spending. Revenue is generally measured by spending put-in-place during the year. Therefore, Revenue does not measure volume growth. In 2022, Nonresidential buildings inflation was 12%, so business volume was 12% less than spending, or 12% less than revenue. Residential volume was 15% less then spending.
When referencing Constant $ growth, remember the dollars for all years are reported here as 2019$. In this table, nominal spending is divided by the inflation INDEX for the year. You can also deduct the percent inflation from any individual year of spending to find inflation adjusted $ for that year alone, however that method would not allow comparing the adjusted dollars to any other year. A baseline year is necessary to compare dollars from any year to any other year.
Reference Inflation Data Construction Inflation 2024
Through December 2023, Total Construction Spending is up 40% for the four years 2020-2023, but, during that same period inflation increased 35%. After adjusting for 35% inflation, constant $ volume is up only 5%. So, while the current $ spending plot shows a four-year total increase of 40% in spending, the actual change in business volume is up only 5% and has just recently returned to the pre-pandemic peak in Feb-Mar 2020.
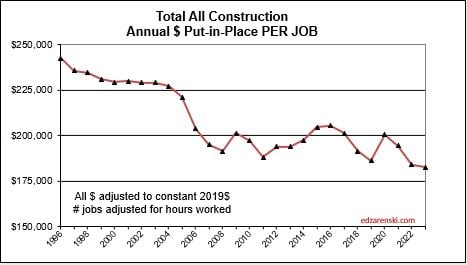
Jobs vs Volume
Construction Jobs increased 2.75% in 2023. We added 214,000 jobs (avg’23-avg’22). There are currently 8,056,000 construction jobs. The largest annual increase post 2010 is 321,000 jobs (+4.6%) in 2018. The average jobs growth post 2010 is 200,000 jobs per year.
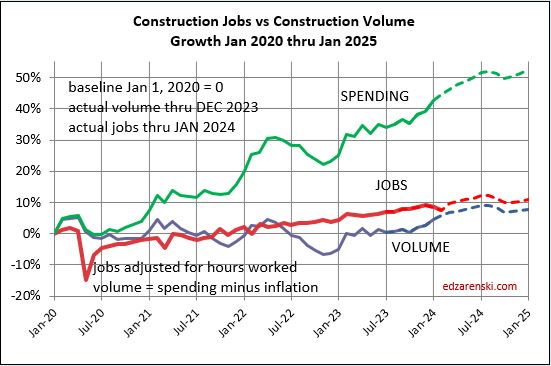
Since 2010, average jobs growth is 3%/yr. Average volume of work growth since 2010 is 2.3%/yr. This plot shows Jobs and Volume growth closely match from 2011 to 2018. With few exceptions for recession periods, this pattern can be seen throughout the historical data.
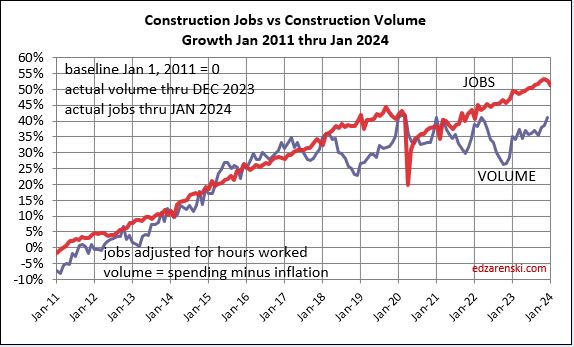
What’s remarkable about the growth is this, since 2016, spending has increased 63%, volume after inflation increased 6% and jobs increased 19%. In the last 7 years, 2017-2023, jobs increased 2.5%/yr. Volume of work increased only 0.8%/yr. Volume and jobs should be moving together.
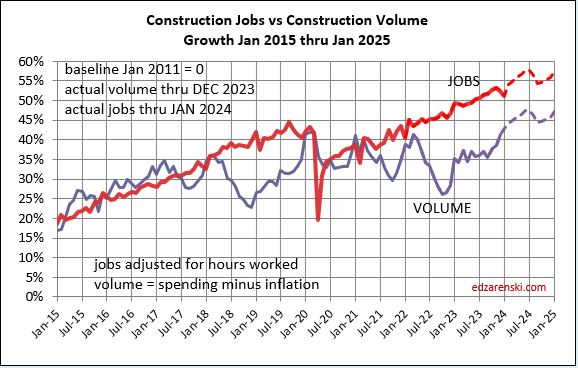
It takes about 5000 jobs to put-in-place $1 billion of volume in one year. It could easily vary from 4000 to 6000. So, an add of $100 billion+ in one year would need 500,000 new jobs. Jobs should track volume, not spending growth. Volume = spending minus inflation.
Normal construction jobs growth is about 250,000 jobs per year and maximum prior growth is about 400,000. From the table above, Nonresidential Bldgs and Non-building Infrastructure added $100bil of volume in 2023 and will add $60bil in 2024. The workload discussed above would theoretically require 500,000 new jobs in 2023 and 300,000 more in 2024. That’s an expansion of the industry workforce by 10% in two years, for just half the industry, in an industry that normally grows in total 3%/yr. This industry can’t grow that fast. This may have some impact if over-capacity growth results in a potential reduction or extension in future forecast. You can’t increase spending that fast if you can’t also expand the labor force and the suppliers to the industry that fast.
In the last 12 months, Dec’22 to Dec’23, Nonres Bldgs jobs are up 4%. Nonres Bldgs spending is up 23%, by far driven by Manufacturing, but after ~5.4% inflation, volume of nonres bldgs workload is up 17%. So, we have a 4% increase in jobs versus a 17% increase in volume.
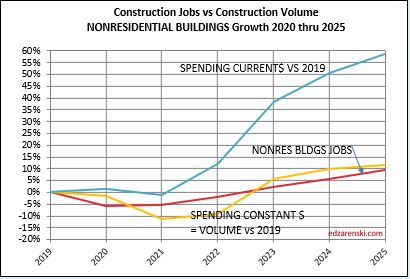
The last year has shown a huge increase in the volume of nonres bldgs work, without an equal increase in jobs. Is this excess nonres bldgs jobs for the past three years now absorbing added workload, (a 4% increase in jobs but a 15% increase in volume), without collapsing the labor force or canceling the volume?
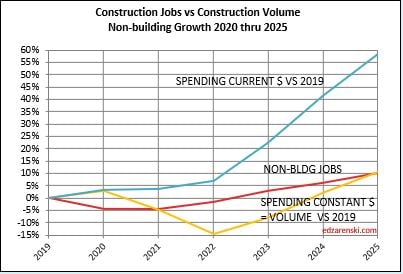
Non-building, over the next two years, could experience the same kind of growth spurt as Nonres Bldgs., a forecast increase in volume the next two years without an equal increase in jobs. Volume which was lower than jobs since 2021, is now increasing faster than jobs. Non-bldg volume is forecast up 6% to
8%/year the next 3 years. Jobs increase at an avg. 3.5%/year.
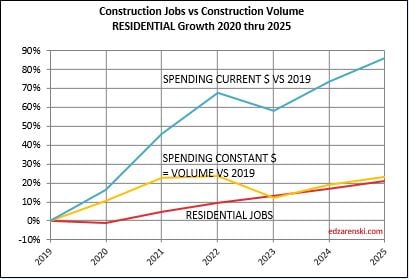
Residential volume has exceeded residential jobs all the way back to 2011. The recent decline in volume brings the two even, if the jobs hold the pace.
For as long as I can remember, the construction industry has been complaining of jobs shortages. And yet, as shown in the data mentioned above, jobs have increased multiples times greater than volume of work. With an exception for recession years, (2007-2010 and 2020), jobs increase at a rate of 2.5% to 3% per year. The greatest disparity between jobs and volume occurred in late 2022, when jobs growth had already resumed normal pace, but volume of work was still reeling from the effects of new construction starts that were canceled dating back to late 2020-early 2021. Recent volume growth at a much faster rate than jobs growth is now closing the gap.
When jobs increase without an equal increase in the volume of work, productivity declines. This recent increase in volume and the projected increase in volume in 2024, several points stronger than jobs, will offset some of the disparity which has been negative for a long time.
Inflation
The following Construction Inflation plot (for Nonresidential Buildings only) shows three elements: 1) a solid grey bar reflecting the max and min of the 10 indices I track in my weighted average inflation index, 2) a solid black line indicating the weighted average of those 10 indices, and 3) a dotted red line showing the Engineering News Record Building Cost Index (ENR BCI). Notice the ENR BCI is almost always the lowest, or one of the lowest, indices. ENR BCI, along with R S Means Index, unlike final cost indices, do not include margins or productivity changes and in the case of ENR BCI has very limited materials and labor inputs.
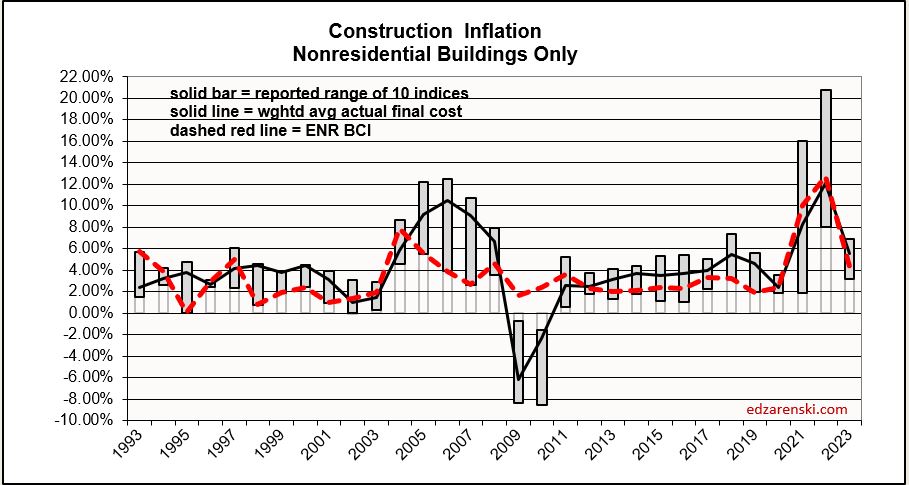
Final cost indices represent total actual cost to the owner and are generally much higher. Producer Price Index (PPI) INPUTS to construction reflect costs at various stages of material production, generally do not represent final cost of materials to the jobsite and do not include labor, productivity or margins. PPI Final Demand indices include all costs and do represent actual final cost. The solid black line (above) represents the Construction Analytics Building Cost Index for Nonresidential Bldgs and is a final cost index.
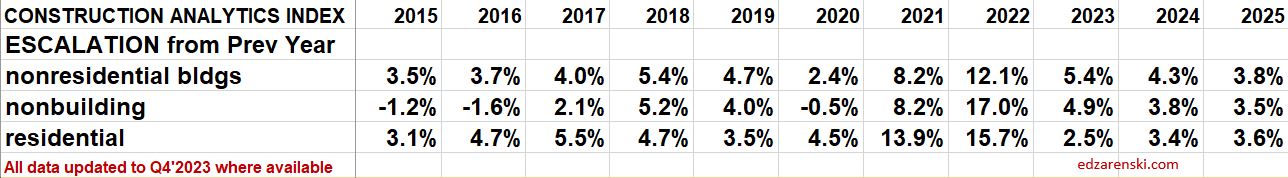
This short table shows the inflation rate for each year. Useful to compare to last year, but you would need to mathematically do the compounding to move over several years. The plot below shows the cumulative inflation index, or the cumulative compounded effect of inflation for any two points in time.

Reference Inflation Data Construction Inflation 2024
Reference Articles Midyear ’23 Jobs Outlook
This article was originally posted at Source link