

So far, minimally deterred by the Federal Reserve’s interest rate hikes, the unemployment rate in the U.S. has stayed near rock bottom. Seasonally adjusted (SA), it’s been less than 4.0% for 15 months in a row, indicative of a labor market that’s about as tight as it has ever been.
In the 15 graphics that follow, the historical figures on employment are presented in charts and analyzed in accompanying text boxes for 30 key sectors in the economy.
There are many instances of astonishing growth in the number of jobs. There are also cases where employment has languished and can draw on few reserves of adrenaline.
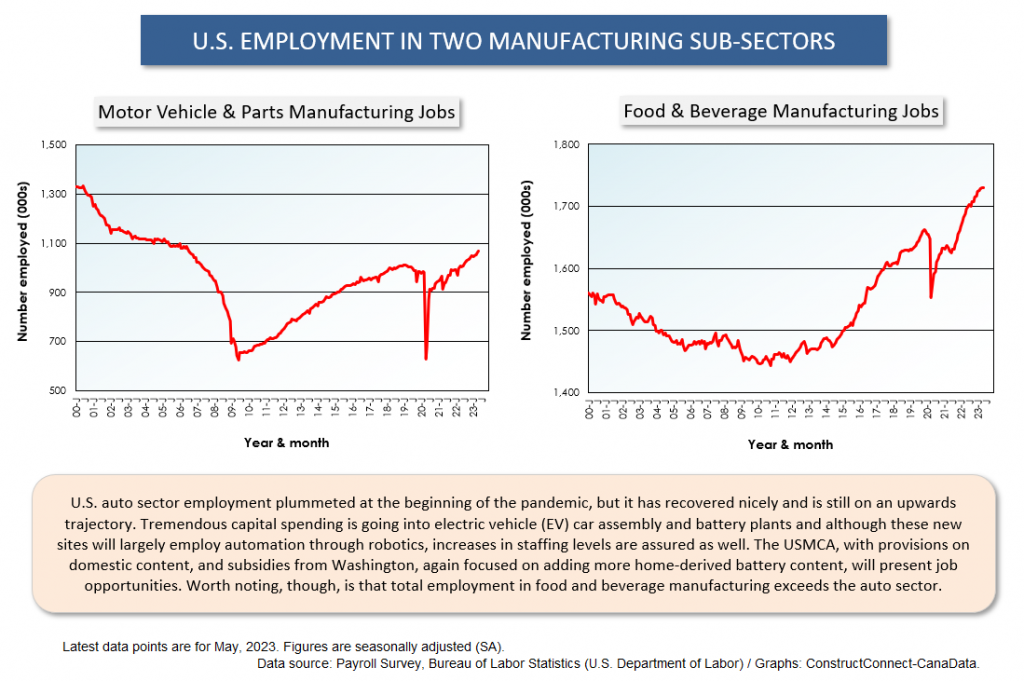
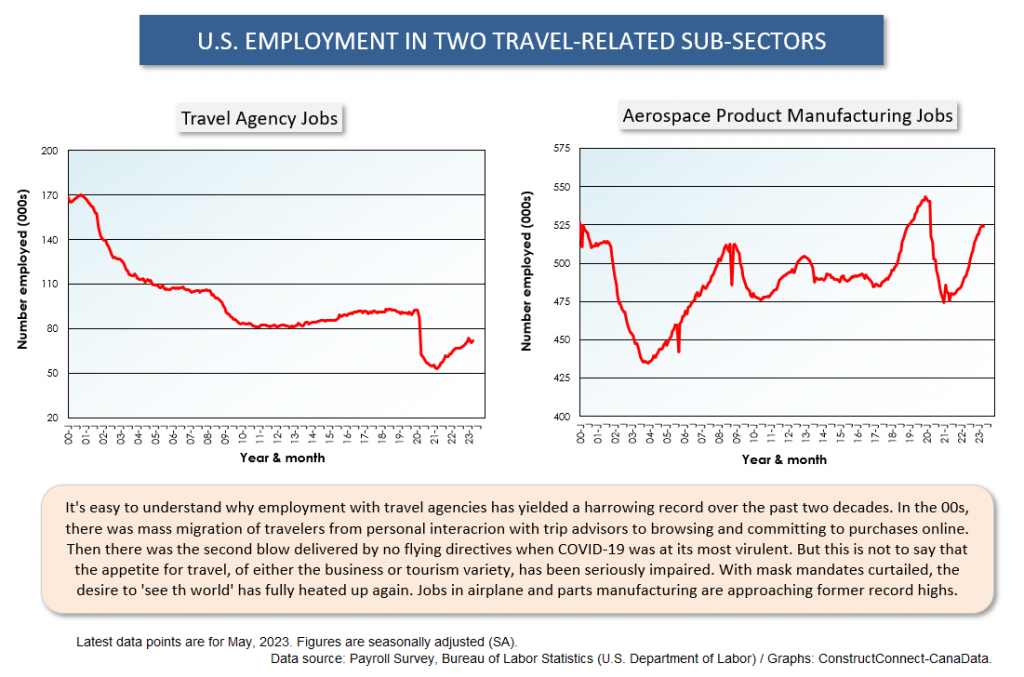
In many of the graphs, deep crevices appear in the number of jobs at the outset of the coronavirus pandemic. What’s interesting is the degree to which recovery has occurred.
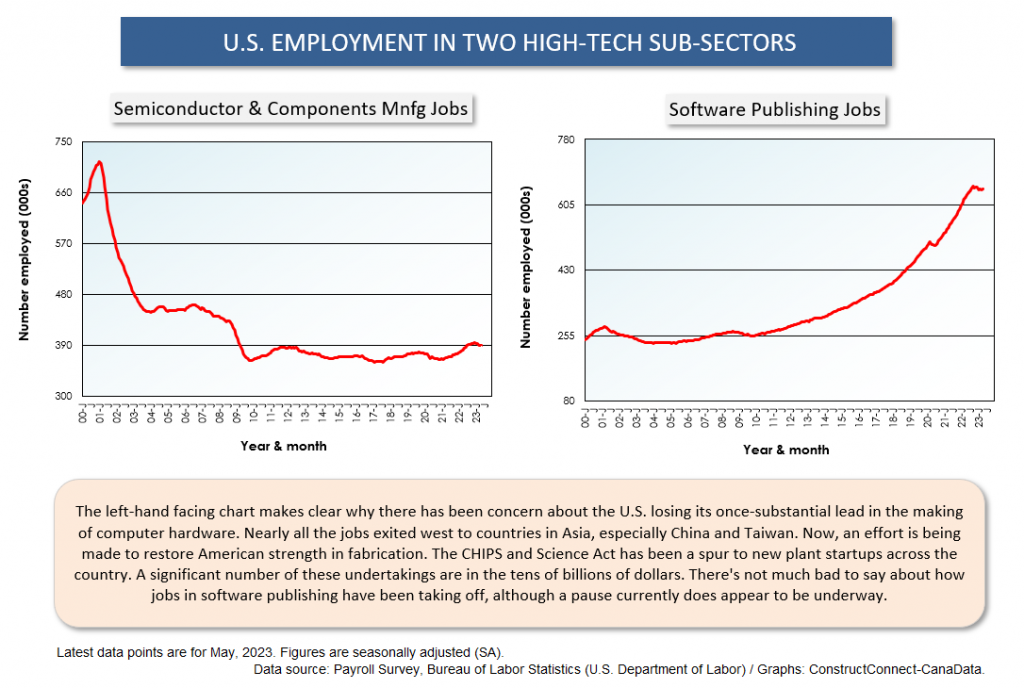
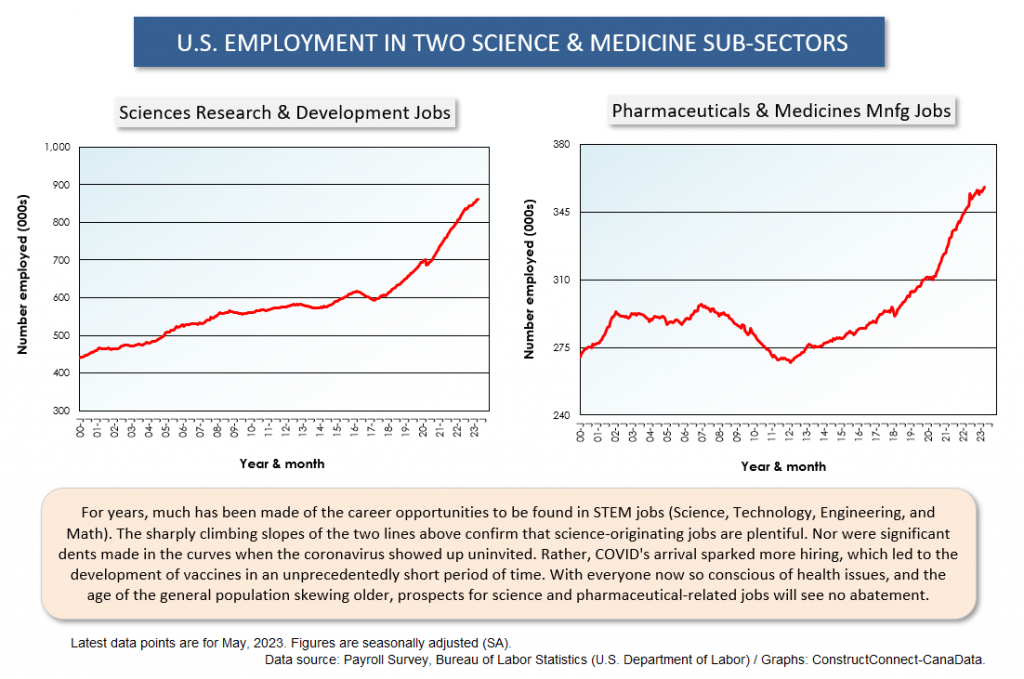
In graphs for other sectors, coronavirus effects washed over them with little or no impact.
A key point moving forward is to realize that there will be job opportunities in areas requiring skill sets barely imagined, outside of science fiction, not so long ago.
The construction industry, which has been listing a shortage of qualified workers as perhaps its biggest problem, especially with experienced trades people retiring in droves, will be hard pressed to fill gaps from the young adult workforce pool.
It’s not really fresh news, but creative recruitment thinking must become a priority.
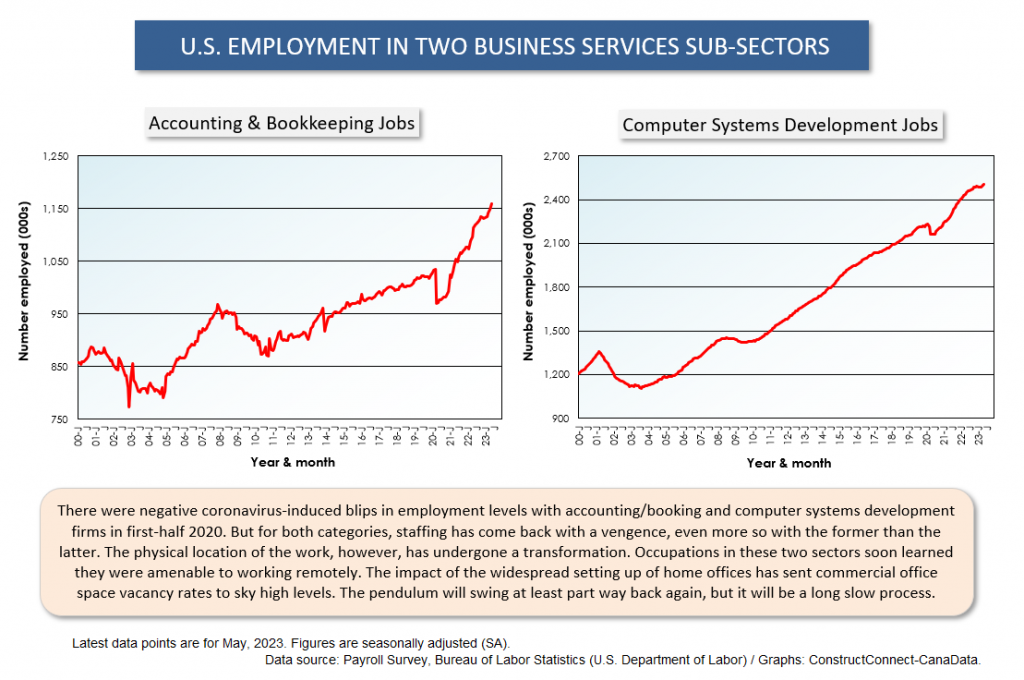
Graph 1
Graph 2
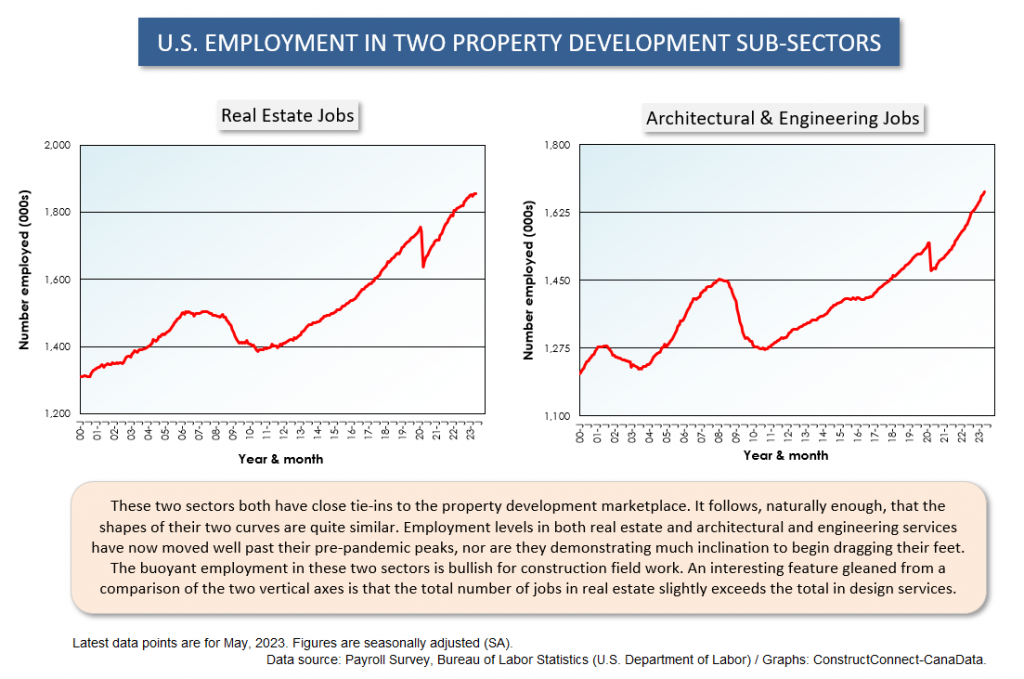
Graph 3
Graph 4
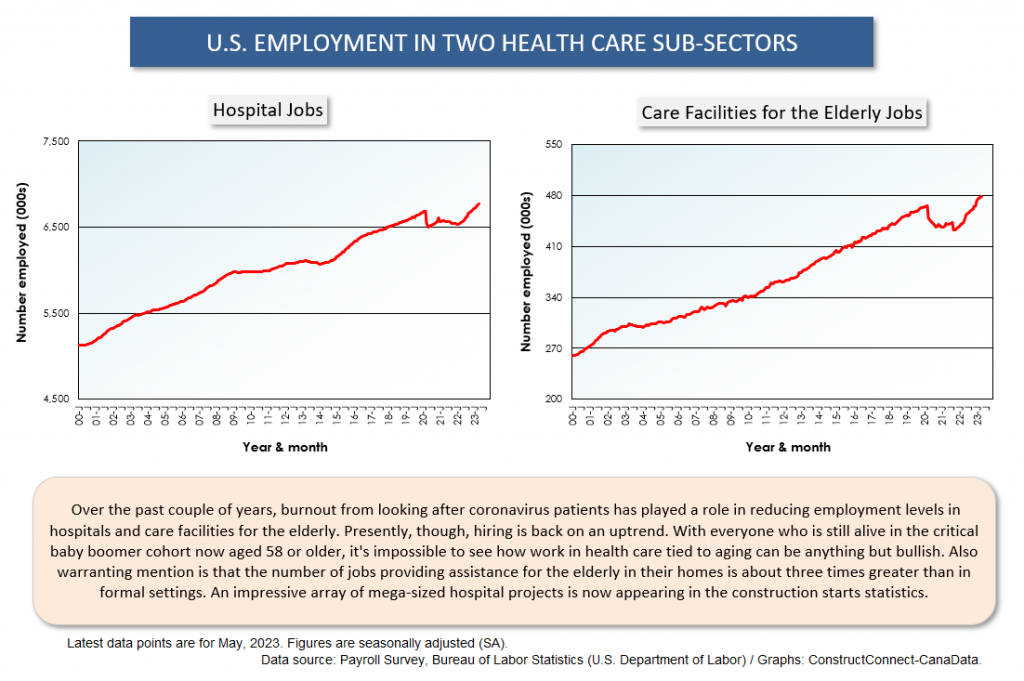
Graph 5
Graph 6
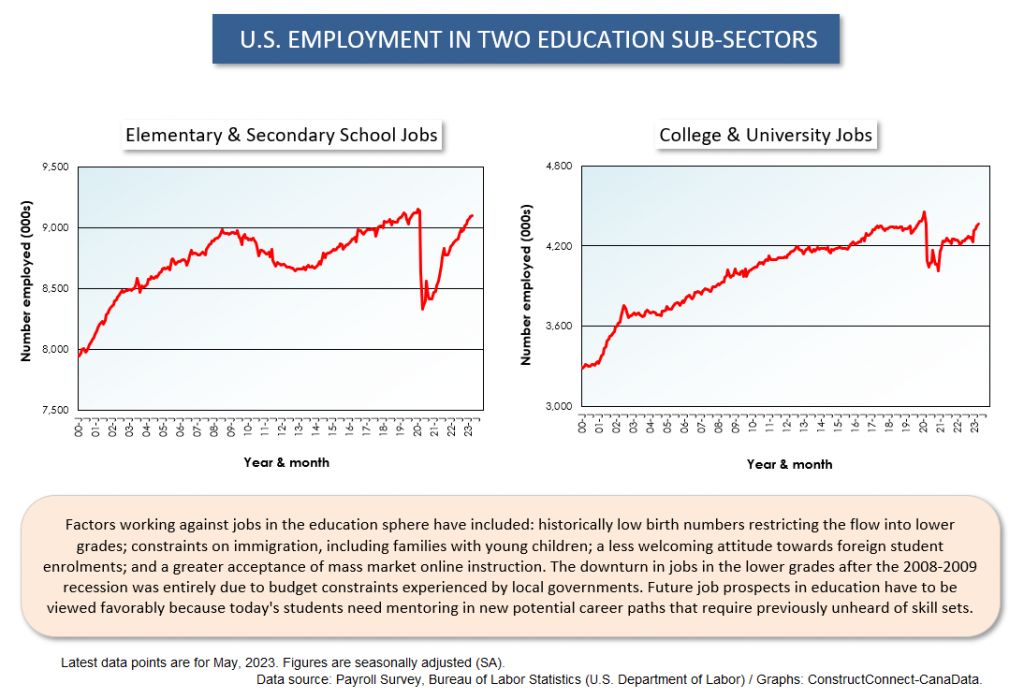
Graph 7
Graph 8
Graph 9
Graph 10
Graph 11
Graph 12
Graph 13
Graph 14
Graph 15
Alex Carrick is Chief Economist for ConstructConnect. He has delivered presentations throughout North America on the U.S., Canadian and world construction outlooks. Mr. Carrick has been with the company since 1985. Links to his numerous articles are featured on Twitter @ConstructConnx, which has 50,000 followers.