[ad_1]
- Construction spending for 2022 in the 2-1-23 release is $520 billion, up 11.6%
- Construction Starts (per Dodge) up ~38% in 2022, up 15% in 2021 and forecast down 10% in 2023.
- Current rate of spending (SAAR avg in Q4) is $560 bil, increasing $5bil-$10bil/month.
The increasing rate of spending makes sense, since starts were up so much in 2021 and 2022, and starts in the prior year is the greatest influence on rate of spending in the current year. Average nonres bldgs spending for 2022 is $520bil and the Q4 rate of spending is $562bil. The current rate of spending (SAAR in Dec) is 8% higher than the 2022 total spending and is increasing.
If something happened to stall spending right now at the current rate, it is at an annual rate of $562 billion, 8% higher than the average from 2022. So, as we begin 2023, with no forecast for a downturn, we could expect 2023 total spending would be at a minimum 8% higher than 2022. Since the current rate of spending is increasing, we could reasonably expect 2023 spending will add to the 8% starting advantage. This is a solid starting point for forecasting 2023 since this is already on record.
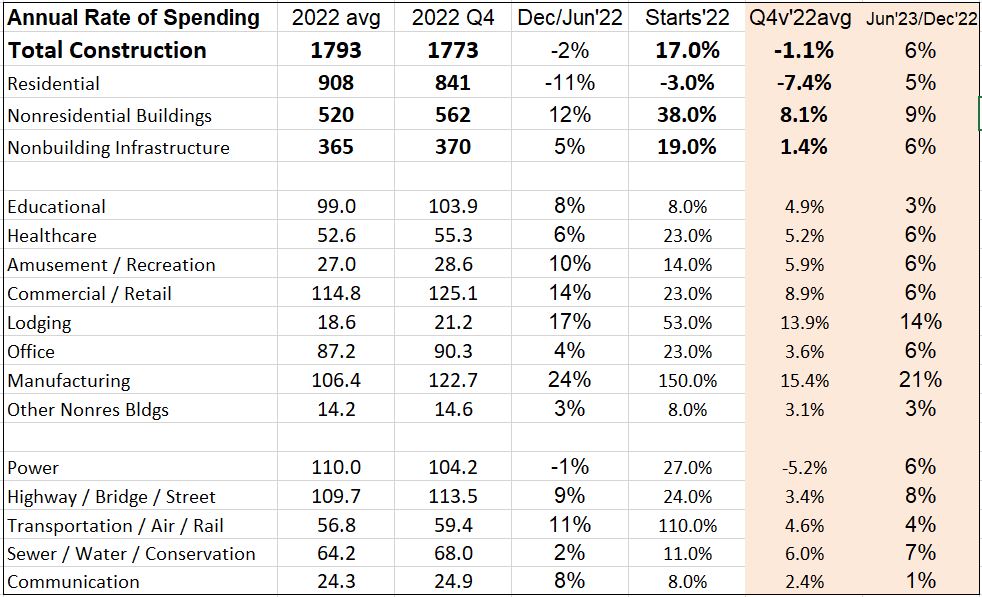
I prepared this following table to show the starting annual rate of spending for all of the markets, in particular the nonresidential buildings markets. As of Q4 2022, or the starting point for 2023, we see a few markets are only 3% to 5% above the 2022 average and a few are considerably higher. Also included in this table is the percent growth in new starts in 2022 for each market.
Let’s use an example: The Educational market, in Q4, or as we begin 2023, has monthly spending at a rate 4.9% greater than 2022. Starts increased 8% in 2022, so there will be a slight to moderate increase to spending in 2023. If spending growth stalls at the current rate, it will finish 2023 at 4.9% over 2022. The only way it should fall to less than that in 2023 is for some decline in some months in 2023 to less than the current rate of spending in Q4. Since all markets have substantial new starts to feed 2023 spending, all markets should post spending in 2023 higher than Q4 2022.
The rate of spending in 2023, being influenced predominantly by a 38% increase in starts in 2022, is projected to continue increasing throughout 2023. The monthly cashflow of the starts $ from all previous years that still generate spending in 2023 is what determines the rate of change in spending. My forecast has nonresidential buildings spending increasing steadily from a rate of $570 billion in January to $625 billion in December.
What data supports my forecast? Spending is already, in Oct-Nov-Dec, 8% higher than the average for 2022, so we begin 2023 at a rate of spending up a minimum 8% higher than the average for 2022. The average for 2023 could fall below the current 8% IF we were to experience some unforeseen negative occurrence in the coming months. I don’t foresee that happening. In 2022 we realized the largest ever one-year increase in new starts, up 38%. Starts were also up in 2021, up 15%. The monthly rate of spending is up 12 of the last 14 months, has increased for 6 consecutive months and is up 10% in the last 6 months. The rate of spending is predicted to increase 10 out of 12 months in 2023, a total increase of 11% over the year. Barring any unforeseen negative occurrence, the trajectory in the rate of spending is increasing and 2023 spending will finish well above the 8% advantage starting at the beginning of the year.
My total forecast for Nonresidential Buildings spending in 2023 is $616 billion, an increase of 18.5% over 2022.
The AIA Consensus Construction Forecast, December 2022 predicts only a 5.8% increase in spending for nonresidential buildings in 2023. Five of the nine forecasts provided in the Consensus Forecast are below the 5.8% consensus average. Only two forecasts are higher than 8% which is the projected minimum growth as we begin 2023, as explained above. As we begin the year with data, as of December, already at a rate 8% greater than the average for 2022, and with record new starts indicating an increasing spending rate, how is a forecast developed lower than that? What’s behind those spending forecasts?
This article was updated on 2-2-23 from November data to December data for clarity and to include the table showing Q4 data. Overall, the premise has not changed.