


[ad_1]
We are close enough, now in mid-January, to see where the numbers will end up for 2024. Construction spending as of Nov is up 6.5% year-to-date vs same 11 months in 2023. We are up 6.0% ytd vs the average of 2023. My forecast predicts we end 2024 up 6.2%, but growth is only 3.4% in 2025.
In February of 2024, with the Dec 2023 data in hand, my forecast for 2024 spending was $2,190 billion, only 1.8% higher than my current (Nov’24 data) forecast of $2,150 billion. Most of that early higher estimate was due to what I carried for my residential forecast, which I have since lowered by 3.6% from the initial forecast at the beginning of 2024. You can see in this monthly summary table that the Nonresidential Bldgs and Non-building forecasts have varied very little and the Total forecast has not varied up or down by more than 0.4% over the last 4 months.
Single family construction spending reached a post-2006 high in Q4’21 thru Apr’22 ($480bil). From Apr’22 to the lowpoint in May ’23 ($360bil) spending dropped 25%. By year-end 2023 it had recovered almost 3/4ths of that drop. It fell again in mid-2024 to $410bil, but has since recovered to the year-end’23 level ($450bil). That drop is reflected in the difference between the current forecast and the earlier forecast.
Construction spending in 2024 will hit near $2.15trillion, another new high, up 54% since 2019.
Caution: the following table, showing Constant$ analysis, now shows Constant$ with base at 2024. Since Q1-2020 I have used the base year at 2019. This update changes the Constant$ amount, but not the Constant$ percent growth. Slight changes in prior years inflation resulted in some minor changes in Constant$ growth.
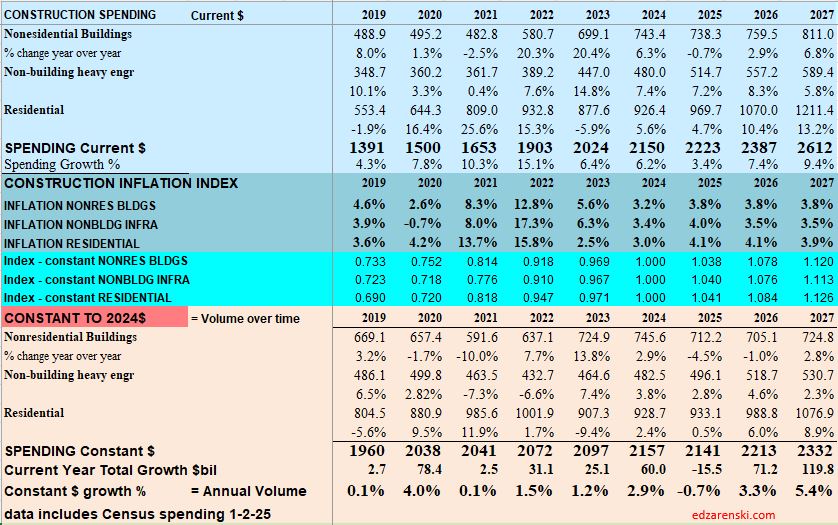
The last time constr spending declined was 2011. But construction spending includes inflation, which adds nothing to the volume of work put-in-place. Construction volume, (spending minus inflation) will finish the year up only 10% since 2019.
My construction spending forecast for 2025 Nonres Bldgs is down 0.7%. But it’s driven by projects ending in Manufacturing (and Warehouse). In the last 3 yrs, there were $230bil Mnfg starts, most in 2022, $130bil above normal, now some are ending. Without Mnfg, nonres bldgs 2025 spending would be up 4.5%. So while outward appearance may be that nonres spending is declining, in large part it is due to mega spending on Manufacturing buildings (and Warehouse) tapering down upon completion, creating very large annual declines, but normal. See The Manufacturing Spending Taper
Last year at this time, many of the Nonres Bldgs and Non-bldg line items showed Nov-Dec spending was already several points higher than the 2023 average. This was an indication leading into 2024 that those markets were on track to start the year already up. This year,most markets show a decline from the 1st half of the year into the 2nd half. Two notable declines are Warehouse and Office w/o Data Centers. Both start 2025 down 5%+ from the average in 2024.
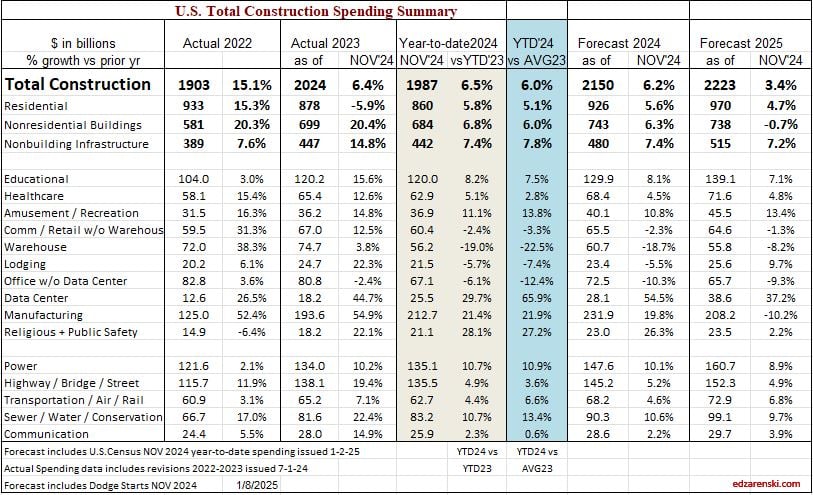
I didn’t realize how much impact there was with the inclusion of (increasing) Data Centers in the (decreasing) Office construction spending values. I’ve now separated Data Centers from Office and Warehouse from Commercial/Retail. Office spending was pretty strong near it’s highs until 2h’22. Early in ’24 it had fallen to 8%-12% below ’22. Office spending is now 15%-18% below 2022. On the other hand, Data Center spending as of Nov is up 30% from the same months in 2023, and is up more than 60% above the average of 2023 and 120% above 2022. It will continue to increase into 2025. Warehouse spending is now decreasing after climbing 100%+ since 2019.
In 2014-2015, Data Centers was less than 5% of total Office+DC construction spending. Today it is approaching 30%. Next year it will approach 40%. In 2015, Warehouse was 25% of total Commercial spending. By 2022 it had climbed to 54%. In 2025, it will fall back to 45%.
Dodge reports as of Nov construction starts for 2024 up 5% YTD. Residential starts up 7%. Nonresidential Buildings starts up 4%. Non-building starts up 5%.
Construction Jobs do not get compared to construction spending. Spending includes inflation, which adds nothing to business volume. Compare jobs growth to Volume growth.
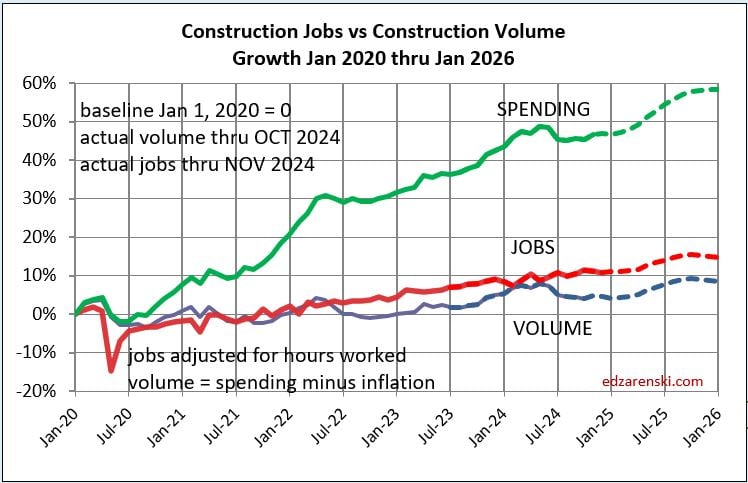
Construction Jobs YTD thru Nov. Rsdn+46k +1.4%. Nonres Bldgs+120k+3.3%. Nonbldg +26k+2.3%
Construction Volume YTD thru NOV Residential +2.9% Nonres Bldgs +3.3% Nonbldg +4.3%.
From 2012-2019, we added on average 240,000 jobs/yr. From 2021-2024, we added 242,000 jobs/yr. We add the most jobs in Feb and Mar. We add the least jobs in Mar and Jun. We add more jobs, by far, in the 1st qtr. than any other qtr.
The unemployment rate in construction goes UP in the 1st qtr every year, by 2% to 3% (data since 2011). Now, your 1st thought is that if unemployment is increasing, that is probably because jobs are falling. Well, construction has ADDED jobs in the 1st qtr. every year since 2011, by an avg of 24% of all jobs added annually, and more recently by over 30% of total annual jobs. Take out the years when we had big declines and you find that we add 35% of annual jobs in Q1. Construction unemployment is not going up in winter months because we lose jobs in winter. It goes up because the entire workforce increases by greater than the number of jobs added.
Harvard Joint Center for Housing Studies posted that In Texas, California, New Jersey, and the District of Columbia, immigrants make up more than half of construction trade workers,
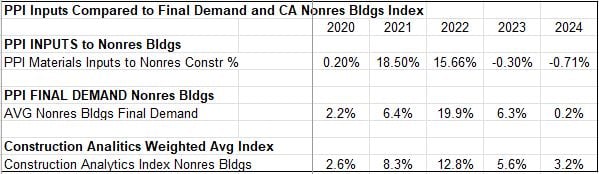
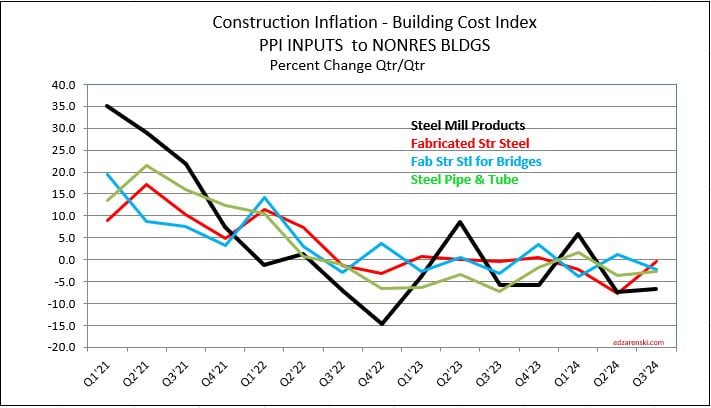
Nov PPI for Construction Mtrls little changed from Oct Inputs YTD to Nonres +0.6%, to Rsdn +1.7%, to Hiway +0.6% Concrete products up 6%, Steel products down 7%-8%, Lumber/Plywood down 2%, Copper up 6%, Diesel down 14%. Final Demand YTD (all in) Nonres Bldgs all up 0.5% or less. Trades up 1%-2%.
We can’t always tell what affect changes in the cost of construction materials will have on the final outcome of annual construction inflation. PPI materials index does not account for productivity or margins and varies on stage of input. A good example of stage of input is PPI for Steel Mill Products. That does not include delivery from mill to fabricator, detailing, fabrication, shop painting, delivery to jobsite, shakeout, lifting, installation and finally overhead and profit, in all about 75% of the cost of structural steel installed.
Construction Analytics Nonres Building Cost Index is a weighted average of eight final cost indices.
NAHB estimates that $184 billion worth of goods were used in the construction of both new multifamily and single-family housing in 2023 and that $13 billon of those goods were imported. eyeonhousing.org/2024/12/impo…
Steel Statistics Cost Increase Effect on Construction? written 2016 US is world’s largest steel importer at 30MMT/yr. 50% from our top suppliers, Canada, Brazil, South Korea and Mexico. China supplies less than 2%. The U.S. annually imports about $2bil from Mexico.
One quarter of all annual Brussel Sprouts consumption occurs around the Christmas holiday.