


[ad_1]
Construction Spending Explained
- New Starts + Existing Backlog generate Spending
- Spending = Revenue
- Revenue includes inflation which adds nothing to volume
- Revenue – Inflation = Business Volume
Construction spending fell slightly in April, down 0.4% from March. Spending has fallen slightly each of the last 3 months, but total spending is still at/near an all-time high with the seasonal rate at $2,200 billion. The forecast predicts spending will increase to 3% growth by year end.
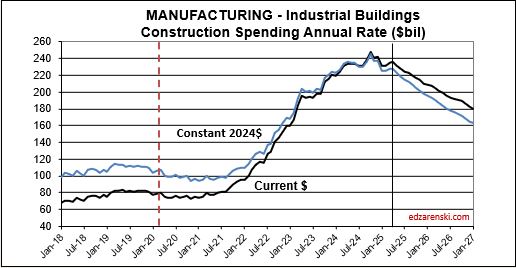
Construction Forecast Update – Data Centers shows the largest % growth for 2025, forecast +33%. Manufacturing is still the largest $ contributor ($223bil/yr) to nonresidential bldgs total spending ($772bil/yr), but has fallen 6% in the last 5 months.
Peak manufacturing construction spending was posted from Sep thru Dec 2024. The avg of 1st 4mo of 2025 is down 4% from that peak. By Q4’25, avg spending will be down 10% from peak.
BTW, this is totally normal. We are beginning the tail end of an above normal huge influx of new manufacturing projects that started over the last 3 years, and the spending curve is beginning the downhill slope. Spending will continue to fall for the next 3yrs.
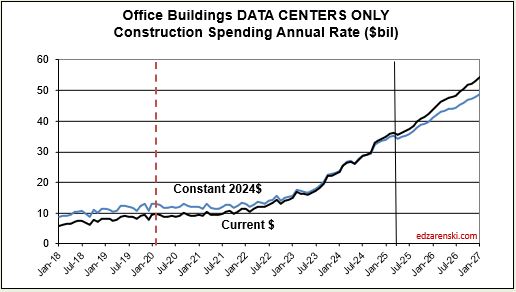
Data Center construction spending has not yet hit peak. Data Centers are continuing on a phenomenal streak of +45% growth in 2023 and +56% in 2024 and now 33% in 2025. The avg of 1st 4mo of 2025 is up 39% from same 4mo 2024. Spending will finish the year almost 20% higher than today. 2025 forecast +33% over 2024. Currently projecting peak spending end of 2027, or later.
Headwinds could slow new starts growth. Many economists predict current trade impacts will slow overall economic growth. That in turn could slow capital expenditures, which, in this case, is new construction starts.
Any capex pause could reduce all Data Center numbers. However, starts are up 400% since 2020 and could finish 2025 up 500%. Would take a lot of canceling or delaying to collapse these numbers. (This is going to first appear in construction starts, “firms pausing or delaying capex.” It’s already started with Data Center).
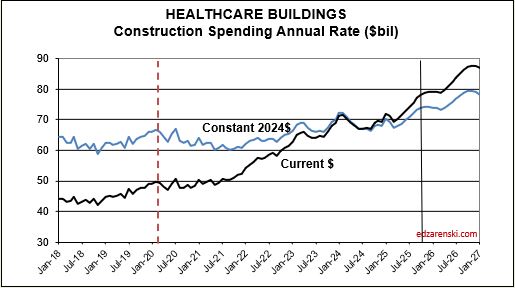
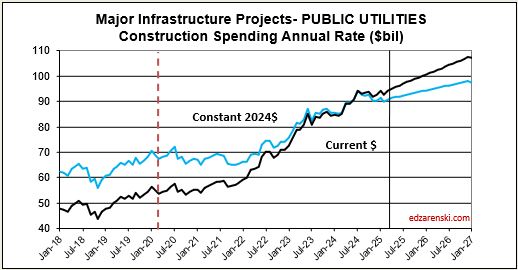
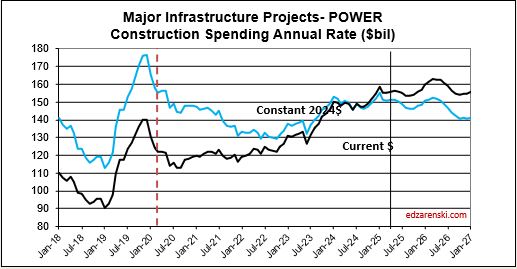
What’s propping up spending growth?
What’s holding spending growth back?
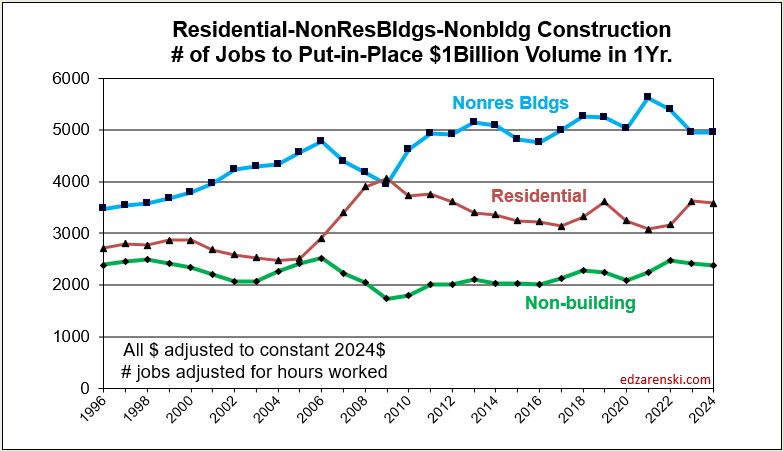
This next plot shows the number of workers required to put-in-place $1 billion of construction in 1 year. Except for Nonbldg Infra, which has remained relatively flat over time, it requires more jobs to put-in-place $1bil today than it did 10 years or 20 years ago. Total construction workforce (8,300,000) divided by # of billions$ put-in-place (2,200 billions$/yr) is the simplest way to show the decline in construction productivity. Results here broken out for major sectors.
Plots showing more recent jobs vs volume spending will be added after release of May jobs data (June 6).