


[ad_1]
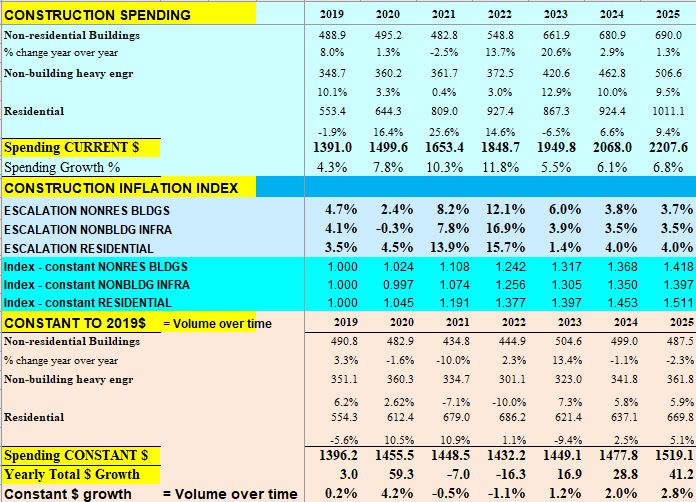
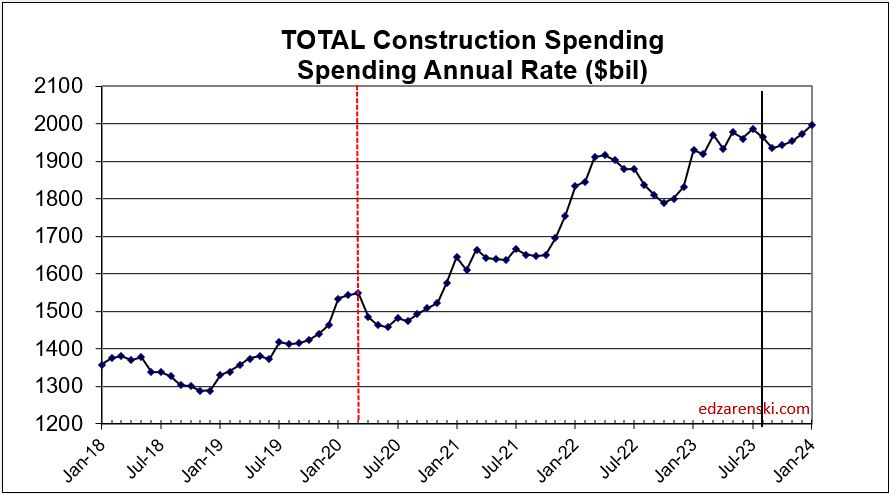
Total Construction Spending in 2023 is forecast at $1,950 billion, an increase of 5.5% over 2022.
Nonresidential Buildings spending is leading Construction spending growth. With eight months in the year-to-date (ytd) for 2023, total all construction spending ytd is up 4.2%. Nonresidential buildings spending is up 22% ytd compared to Jan-Aug 2022, the fastest rate of nonres bldgs growth in over 30 years. Only 2006 & 2007 come close at 13% & 19% growth years. Nonbuilding spending ytd is up 12%. Residential Spending ytd compared to Jan-Aug 2022 is still down -8.7%. Residential spending peaked in Mar 2022 and had a recent bottom in Apr 2023. Since April, the annual rate of residential spending is up 5.6%, almost entirely due to an 8% increase in the largest segment, single family spending, 45% of all residential spending. Multifamily spending is is up 6%, but it’s only 15% of residential spending.
Spending Forecast
Total Construction Spending in 2023 is forecast at $1,950 billion, an increase of 5.5% over 2022.
Nonresidential Buildings spending is forecast at $662 billion, an increase of 20.6% over 2022.
Non-building Infrastructure spending is forecast at $421 billion, an increase of 12.9% over 2022.
Residential Buildings spending is forecast at $867 billion, a decline of -6.5% less than 2022.
This forecast does not include a recession.
Spending by Sector Current $ and Inflation Adjusted Constant $
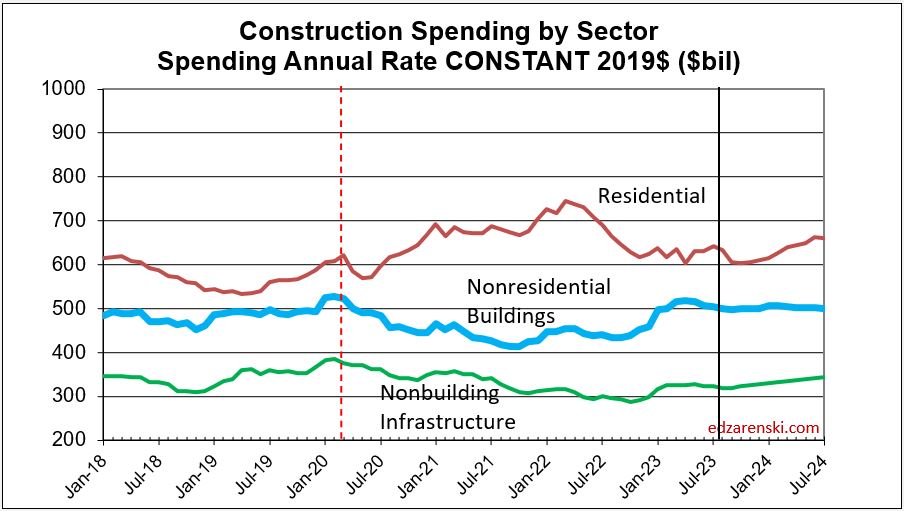
In 2023, it’s Nonresidential Buildings leading growth. In 2024, it will be Non-building Infrastructure leading spending growth. Both are expected to post spending growth greater than the inflation index, so there will be real volume growth. In 2020+2021, residential volume grew 10%/yr. For 2023, residential volume drops 10%. Nonresidential Bldgs will post a 13% increase in volume in 2023 and flatten out at that level through 2024. Non-building volume increases 6% to 7%/yr for the next few years.
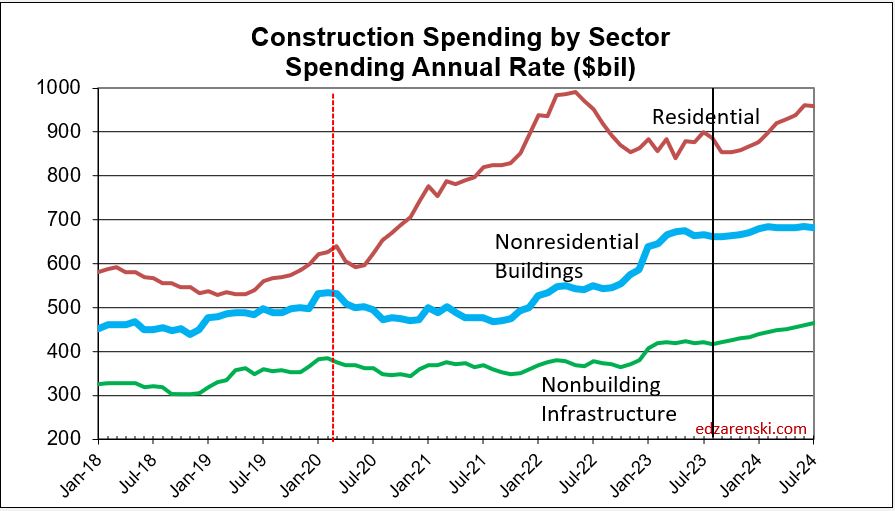
The rate of construction spending in 2023 will be influenced predominantly by a 50% increase in new nonresidential building starts in 2022. In recent years, new nonres bldgs starts averaged $300 billion/year. In the 2nd half of 2022, starts averaged near $500 billion/year. From Mar-Aug 2023 starts averaged $400 billion/year. Many of those projects will have peak spending in 2023 or 2024.
Residential construction (Dodge) starts posted the five highest months ever, all in the 1st 6 months of 2022. In the second half of 2022, residential starts fell 15%. In Q1 2023, residential starts dropped another 12% below 2nd half 2022. Finally in July and August, starts regained some strength coming in 33% higher than the lows in Q1. Residential starts are still down 17% year-to-date vs 2022.
Nonresidential Buildings, in 2022 posted the largest ever one-year increase in construction starts, up 50%. Nonres Bldgs starts in the 2nd half 2022, averaged 67% higher than any other 6mo period in history. Starts fell 20% in the 1st half 2023 but still posted the 2nd highest 6mo average ever. Nonres Bldgs starts are down 17% ytd.
Growth in Manufacturing construction starts for 2022 far surpasses growth in any other market, up over 150%.
Non-building starts for the 6 month period Mar-Aug 2023 posted the best 6 months on record, up 30% from the average of 2022. The 2nd half 2022 was up 50% over 1st half 2022. The 6 months Mar-Aug 2023 is up 18% from 2nd half 2022. For 2023, Highway/Bridge and Power have the strongest gains. Total Non-building Starts for 2023 are forecast up 25%. Non-bldg starts are up 22% ytd.
Current $ Spending, Inflation and Constant $ Volume
Inflation adjusted volume is spending minus inflation, or to be more accurate, spending divided by (1+inflation). Inflation adds nothing to volume growth. The following table shows spending, inflation and volume (spending without inflation) for each year. Spending is current to the year stated. The values in the constant table are indexed to a constant value year, 2019. This shows business volume year to year, can be a lot different than spending would indicate. When inflation is positive, volume is always less than spending by the amount attributed to inflation.
SEE Construction Inflation 2023
Spending during the year is the value of business volume plus the inflation on that volume. When inflation is 12%, volume plus 12% = total spending. Revenue is generally measured by spending put-in-place during the year. Therefore, Revenue does not measure volume growth. In 2022, Nonresidential buildings inflation was 12%, so business volume was 12% less than spending, or 12% less than revenue. Residential volume was 15% less then spending.
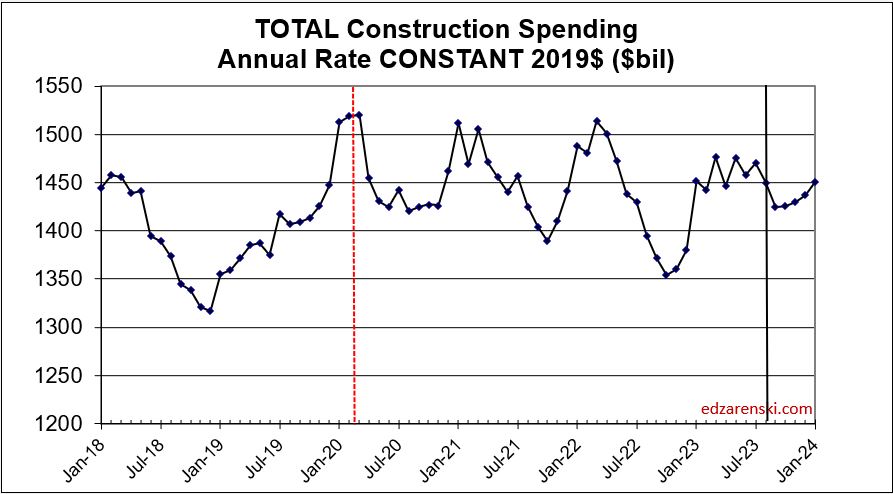
Through August 2023, Overall Construction Spending is up 27% in the 42 months since the onset of the pandemic, but, during that same period inflation increased 33%. After adjusting for 33% inflation, constant $ volume is down 6%. So, while the plot on the left shows three years of increases in spending, the actual change in business volume is still down and has not yet returned to the pre-pandemic peak in Feb-Mar 2020.
Does Volume of Work Support Jobs Growth?
or, Can jobs growth support volume of work?
Jobs should track volume, not spending growth. Volume = spending minus inflation. Volume is down, although now increasing, while jobs are up. Nonres Bldgs volume, in constant $, fell 25% from Feb 2020 to Sept 2021, and hit a secondary low in mid-2022. Since then, the actual change in nonres bldgs volume has increased 18%. Yet nonres bldgs jobs increased only 3.5%. That still leaves volume nearly 10% lower than the pre-pandemic high. If the same production levels ($ put-in-place per worker) as 2019 were to be regained, theoretically, nonresidential volume would need to increase 10% with no increase in nonresidential jobs. For now, productivity is well below that of 2019, but it is improving because volume is increasing rapidly and jobs are increasing slowly.
Nonresidential Buildings spending in 2023 is forecast at $660 billion, an increase of 20.6%, or an increase of $113 billion in 2023. Non-building Infrastructure spending is forecast up 13% ($50bil) in 2023 and 10% ($40bil) in 2024.
Generally, it takes 5000 jobs to put-in-place $1 billion in one year. It could easily vary from 4000 to 6000. So an add of $100 billion+ in 2023 would need 500,000 new jobs. Adding $200 billion over two years would need 1,000,000 new jobs.
These two plots will be updated after jobs report 9-6-23.

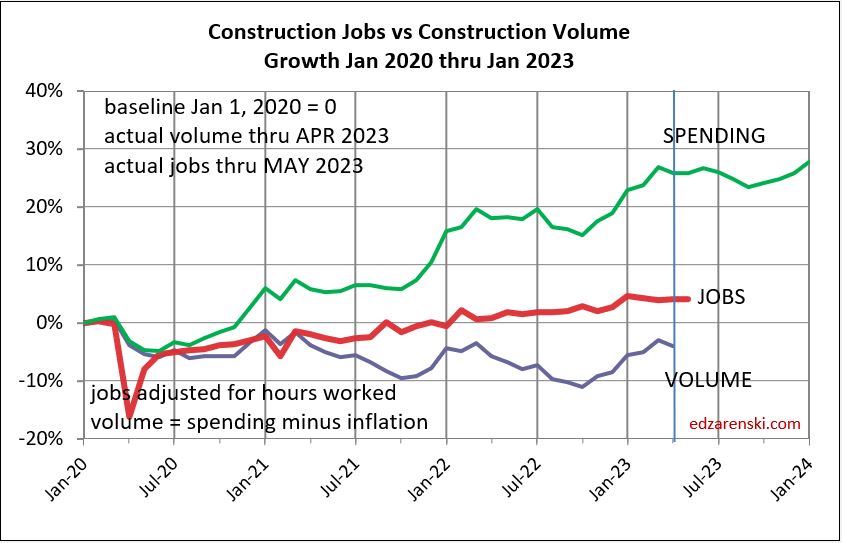
If we were to grow the labor force to meet the newly identified workload added from new starts, we would need to double the prior maximum rate of construction jobs growth. Normal construction jobs growth is about 250,000 jobs per year and maximum prior growth is about 400,000. The workload discussed above would require 500,000 new jobs/yr., back to back. That’s an expansion of the industry by 15%, in an industry that normally grows 3%/yr. This industry can’t grow that fast. (Which means we may all need to account for over-capacity growth as a potential reduction in future forecast. You can’t increase spending that fast if you can’t also expand the labor force and the suppliers to the industry that fast).
My first thoughts were, Jobs may not be able to increase fast enough to put-in-place the forecast spending. This impediment needs to be accounted for and could reduce overall construction spending forecast over the next two years. The most likely markets where a reduction might occur are Manufacturing, Highway and Public Utilities.
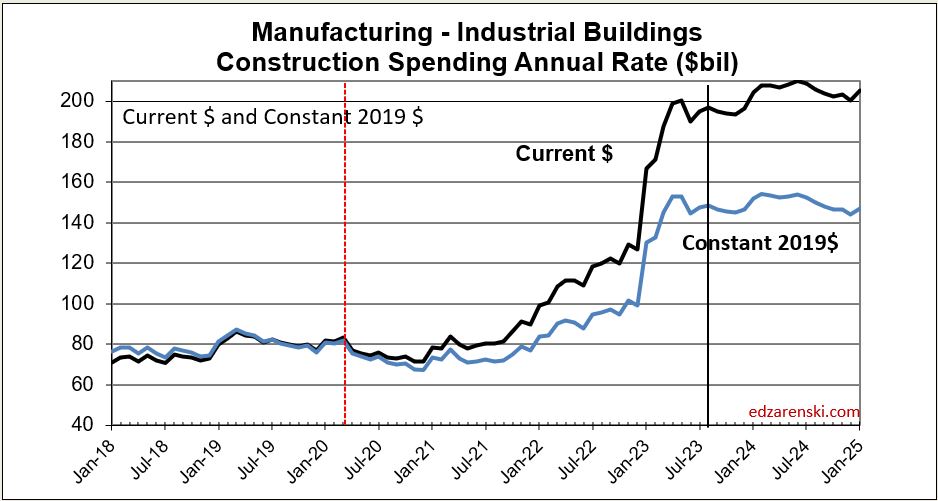
However this is what happened the past year. In the last 12 months, Aug’22 to Aug’23, Nonres Bldgs jobs are up 3.8%. Nonres Bldgs spending is up 21%, by far driven by Manufacturing, but after ~6% inflation, volume of nonres bldgs workload is up 15%. So, we have a 3.8% increase in jobs to accomodate a 15% increase in volume.
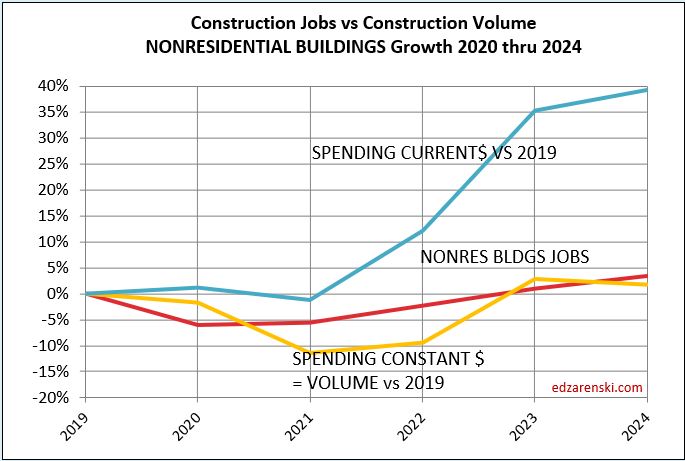
The last year has shown a huge increase in the volume of nonres bldgs work, without an equal increase in jobs. This shows the excess nonres bldgs jobs for the past three years is now absorbing new workload, (a 3.8% increase in jobs to accomodate a 15% increase in volume), without collapsing the labor force or canceling the volume. However, the ability to absorb work into the existing workforce cannot continue.