

[ad_1]
Overall forecast has not changed a lot from the last two months. I’ll add much more to this post in the coming days, but for now here is a summary of spending through November, Inflation through 3rd qtr or Nov where available, and resulting constant dollar volume.
As we begin 2024, the current rate of spending for Nonresidential Buildings is already 3.5% higher than the average for 2023, but monthly rate of growth slows to less than 0.5%/mo in 2024. Non-building Infrastructure is currently only 1% higher than the average for 2023, however the forecast is indicating steady grown of 1%/mo for all of 2024. Residential current rate of spending is 1.5% above the 2023 average and is forecast to average an increase of 0.5%/mo for 2024.
One big question is how did the forecast for Manufacturing increase so much since the beginning of 2023. The starts forecast for 2023 has increased by 35% since January. Starts for future years increased by 50%. Starts (contract awards) drives up the spending forecast since spending is a function of the future monthly cash flow (spending) of starts.
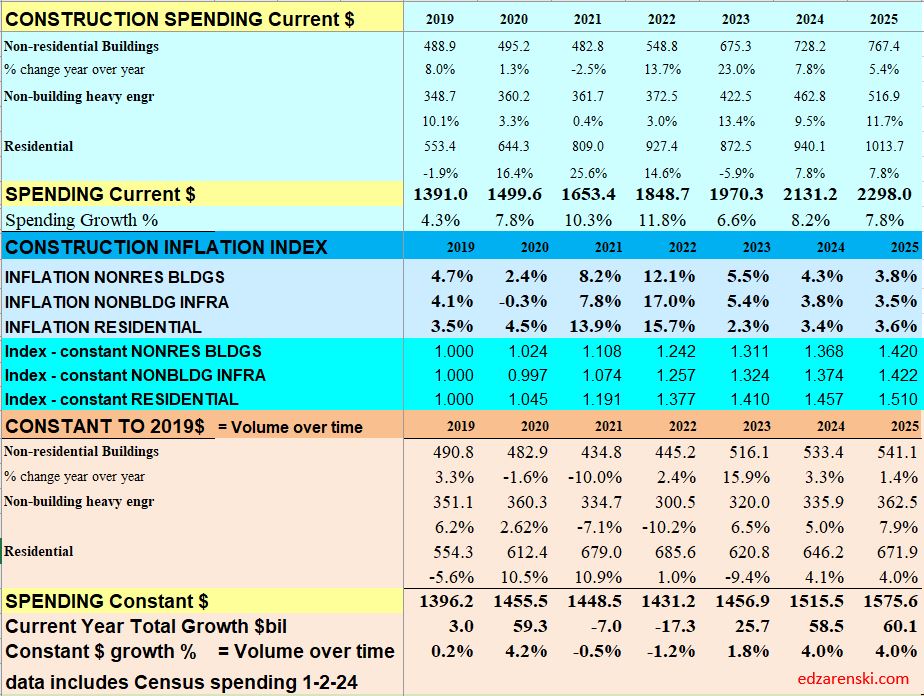
Remember when referencing the Constant $ growth that the dollars for all years are reported here in 2019$. In this table, the nominal spending is divided by the inflation INDEX for the year. You can also deduct the percent inflation from any individual year of construction spending to find inflation adjusted $ for that year alone, however that method would not allow comparing the adjusted dollars to any other year. Setting a baseline year is necessary to compare dollars from any year to any other year.
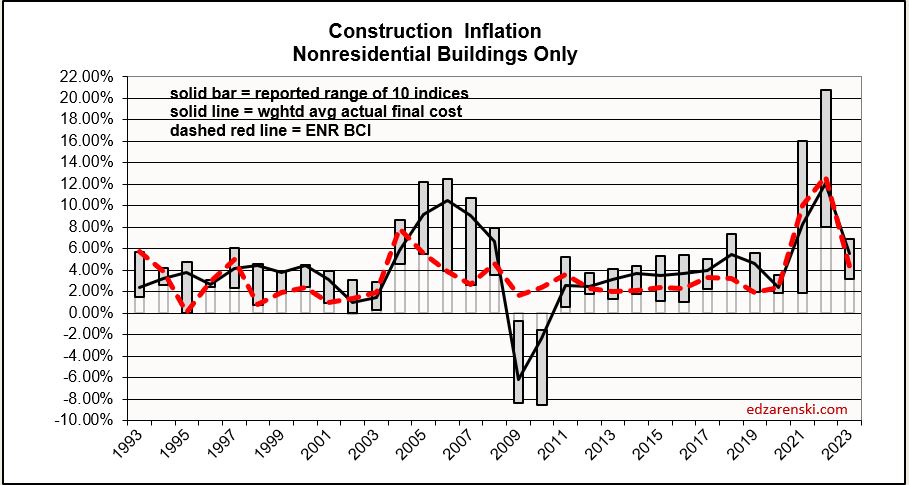
The following Construction Inflation plot (for Nonresidential Buildings only) shows three elements: 1) a solid grey bar reflecting the max and min of the 10 indices I track in my weighted average inflation index, 2) a solid black line indicating the weighted average of those 10 indices, and 3) a dotted red line showing the Engineering News Record Building Cost Index (ENR BCI). Notice the ENR BCI is almost always the lowest, or one of the lowest, indices. ENR BCI, along with R S Means Index, unlike final cost indices, do not include margins or productivity changes and in the case of ENR BCI has very limited materials and labor inputs. Final cost indices represent total actual cost to the owner and are generally much higher. Producer Price Index (PPI) INPUTS to construction reflect costs at various stages of material production, generally do not represent final cost of materials to the jobsite and do not include labor, productivity or margins. PPI Final Demand indices include all costs and do represent actual final cost. The solid black line represents the Construction Analytics Building Cost Index and is a final cost index.