


[ad_1]
Commentary on recent/current cost indices will be added soon. This establishes a post to include all PPI data and construction indices for 2024.
Why Track Construction Inflation
Usually construction budgets are prepared from known “current” costs. If a budget is being developed for a project whose midpoint of construction costs is two years in the future, you must carry in your budget an appropriate inflation factor to represent the expected cost of the building at that time. Why the midpoint? Because half the project cost occurs prior to that point and half occurs later than that. Actually, the midpoint of spending is 50-60% into the schedule, but the calculation to the midpoint of schedule is very close. Construction inflation should always be calculated from current cost to midpoint of construction, or in the case of converting an older actual cost to a future budget, from midpoint to midpoint.
Any time a construction project is delayed or put on hold to start at some future date, construction cost inflation must be calculated and added to the previous budget to account for the unanticipated cost increase due to the delay. Of utmost importance is using appropriate cost indices and forecasting future cost growth to account for the difference in original budget and revised budget.
Besides the estimator’s need to accurately reflect future expected cost, inflation is an important aspect of the company business plan. Typically discussed in tandem with spending, inflation has an impact on tracking and forecasting company growth. All spending includes inflation, but inflation adds nothing except $ signs to the overall growth. To accurately calculate growth, and the need for labor to support that growth, spending must be adjusted down by the amount of inflation.
Types of Construction Inflation Indices
General construction cost indices and Input price indices that don’t track whole building final cost do not capture the full cost of inflation on construction projects.
Consumer Price Index (CPI), tracks changes in the prices paid by consumers for a representative basket of goods and services, including food, transportation, medical care, apparel, recreation, housing. The CPI index in not related at all to construction and should not be used to adjust construction pricing.
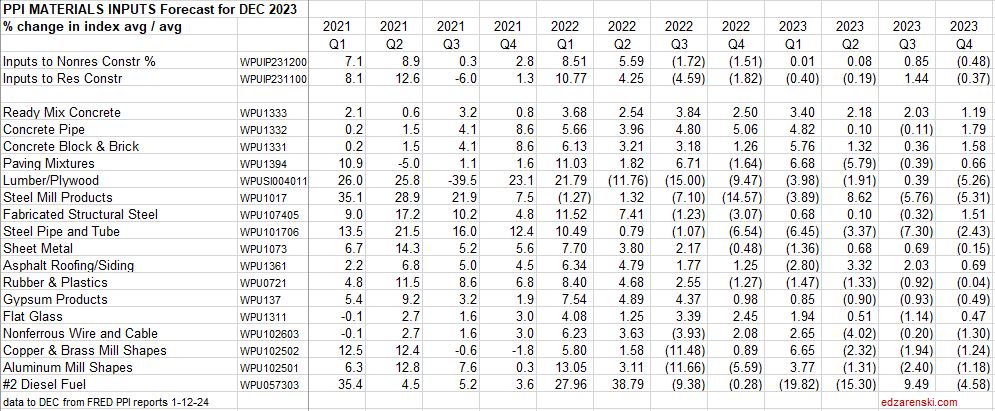
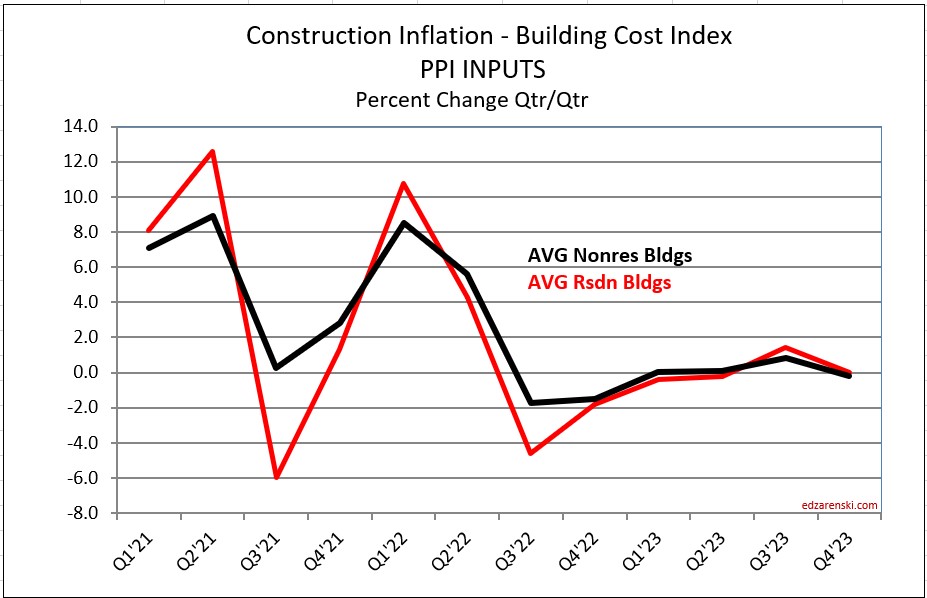
Producer Price Index (PPI) for Construction Inputs is an example of a commonly referenced construction cost index that does not represent whole building costs. The PPI tracks material cost inputs at the producer level, not prices or bids at the as-built level.
Engineering News Record Building Cost Index (ENRBCI) and RSMeans Cost Index are examples of commonly used indices that DO NOT represent whole building costs yet are widely referenced by construction firms and estimators everywhere to adjust project costs. Neither includes contractor margins.
It should be noted, there are far fewer available resources for residential inflation than for nonresidential inflation.
One of the best predictors of construction inflation is the level of activity in an area. When the activity level is low, contractors are all competing for a smaller amount of work and therefore they may reduce bids. When activity is high, there is a greater opportunity to bid on more work and bids can be higher. The level of activity has a direct impact on inflation.
To properly adjust the cost of construction over time you must use actual final cost indices, otherwise known as selling price indices.
Selling Price is whole building actual final cost. Selling price indices track the final cost of construction, which includes, in addition to costs of labor and materials and sales/use taxes, general contractor and sub-contractor margins or overhead and profit.
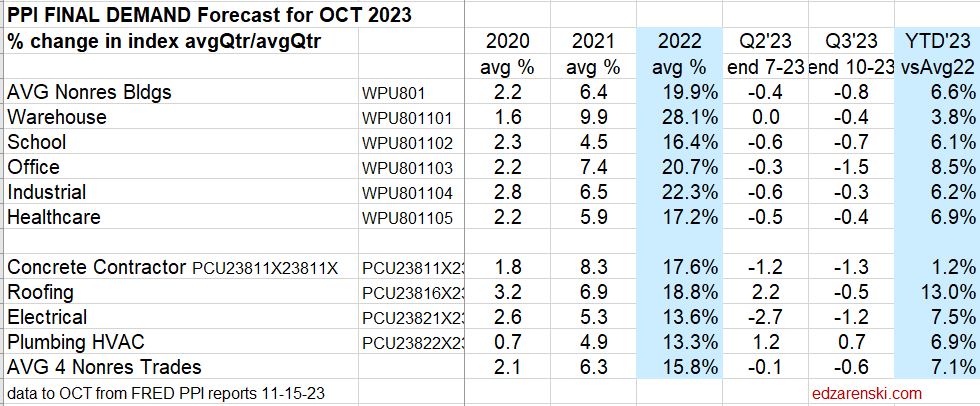
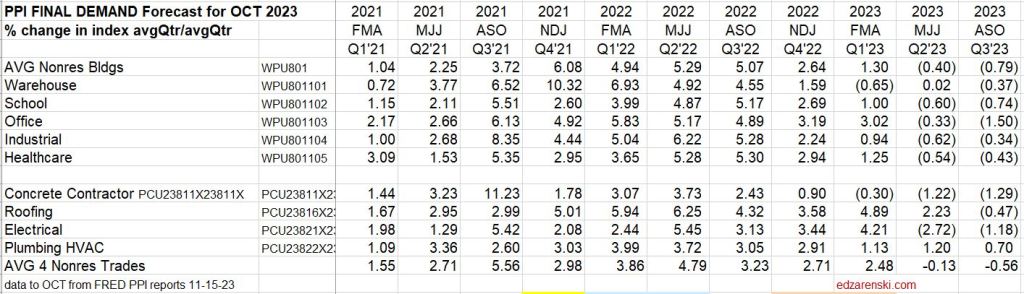
Producer Price Index (PPI) Final Demand Indices are an example of construction cost index that represent whole building costs. Final Demand PPI, or Selling Price, represents contractors bid price to client. Includes labor, material, equipment, overhead and profit. Labor includes change in wages and productivity.
Every three months (Jan, Apr, Jul, Oct) BLS performs an update survey to correct the PPI Final Demand indices. For the past six quarterly updates, about 80% to 90% of the change in the index was posted in the update month. Therefore, PPI Final Demand indices should not be referenced monthly. These are quarterly indices. January is an update month. PPI Final Demand for Jan index is basically the correction for Nov and Dec. The index should NOT be compared mo/mo. Compare qtr/qtr, but make sure to use the correct update month with two other months, (Jan +Dec+Nov)/(Oct+Sep+Aug).
Refer to National Inflation Indices for comparison to several national selling price indices or various Input indices. National reference indices are useful for comparison. Few firms project index values out past the current year, therefore all future projections in these tables are by Construction Analytics.
Differences in Tracking Period
Be careful when referencing YTD growth. YTD is the growth so far this year, that is, growth compared to December of the prior year. That does not represent the growth from the avg for the previous year. The average growth for the year accounts for all the peaks and valleys within each year and is the value carried forward into the index tables and charts.
Also use caution when referencing Dec/Dec growth. A glaring example of the difference between Dec/Dec tracking, or year over year, and annual average tracking, is Steel Mill Products which was down 28.7% Dec22/Dec21, but the annual average for 2022 is still up 9.0% from the average 2021. In fact, the three years 20-21-22 show Dec/Dec combined inflation is +71%, but the annual averages for those same three years shows total inflation growth of 87%. Annual averages should be used to report inflation.
Producer Price Index Construction Mtrls Indices
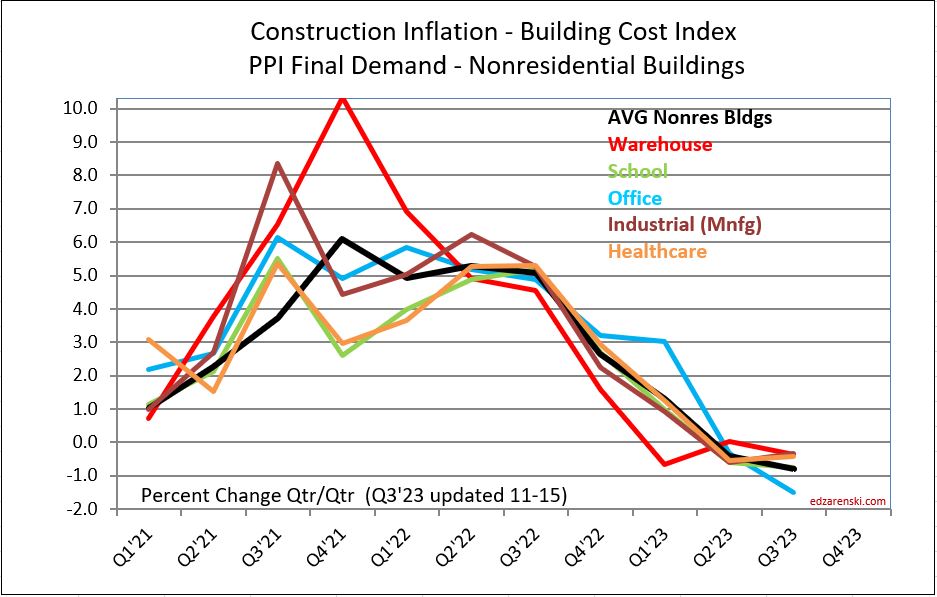
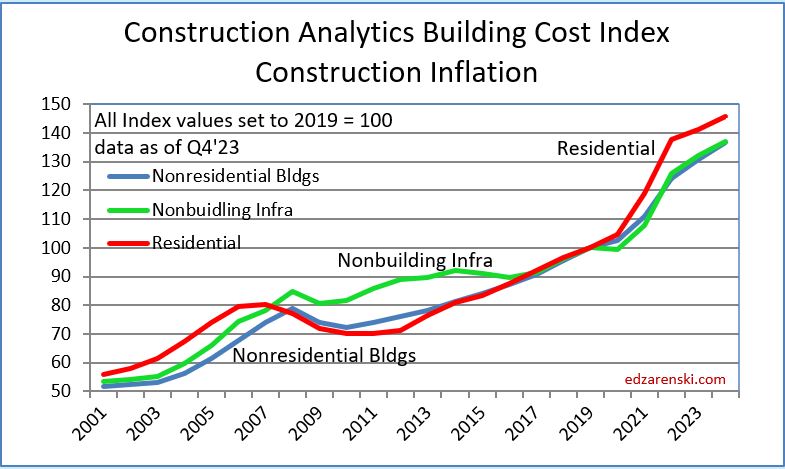
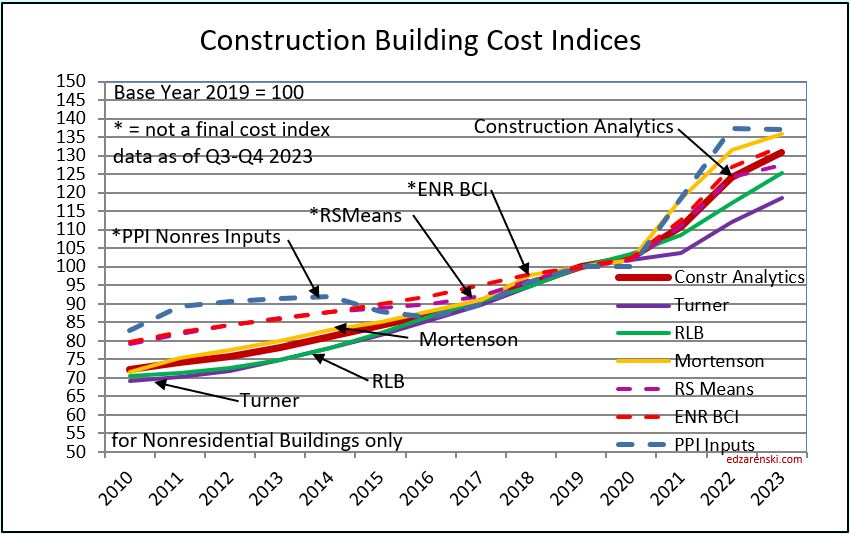
Construction Analytics Building Cost Indices and Reference Indices
Current and predicted Inflation updated to Q4’23 1-13-24
- 2022 Rsdn Inflation 15.7%, Nonres Bldgs 12.1%, Nonbldg Infra 17.0%
- 2023 Rsdn Inflation 2.5%, Nonres Bldgs 5.4%, Nonbldg Infra 4.9%
- 2024 Rsdn Inflation 3.4%, Nonres Bldgs 4.3%, Nonbldg Infra 3.8%
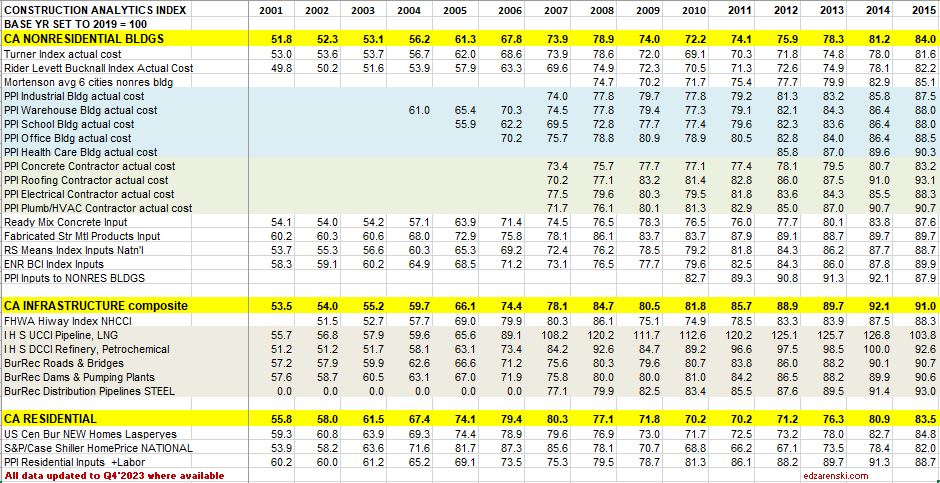
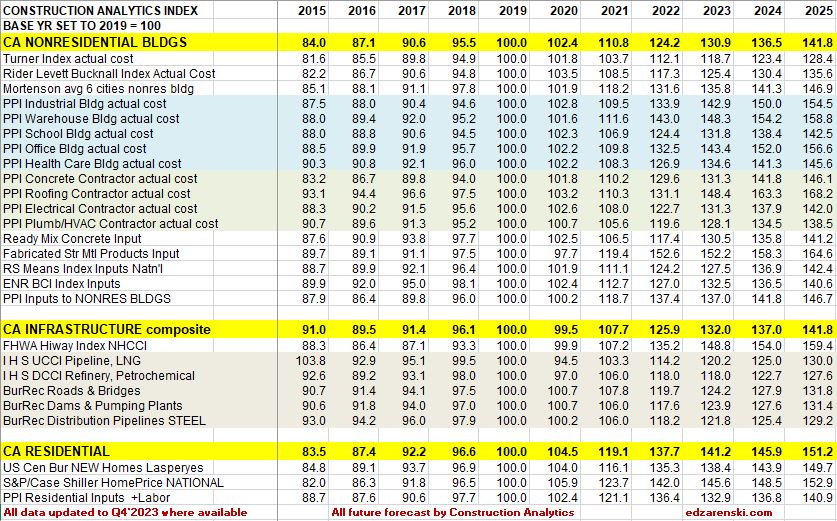
In the tables above, dividing the current year by the previous year will give the current year inflation rate. All indices are the average rate for the year.
Also in the tables above, all reference indices data is gathered from the original source, then all are normalized to a common base, 2019 = 100. This allows us to see how different indices compare.
Most of the tables and plots here are cumulative indexes. Construction Inflation annual percents for the three major sectors, Residential, Nonresidential Bldgs and Non-building Infrastructure, are recorded in this table.

How to use an index: Indexes are used to adjust costs over time for the effects of inflation. An index already compounds annual percent to prevent the error of adding annual percents. To move cost from some point in time to some other point in time, divide Index for year you want to move to by Index for year you want to move cost from, TO/FROM. Costs should be moved from/to midpoint of construction, the centroid of project cost. Indices posted here are at middle of year and can be interpolated between to get any other point in time.
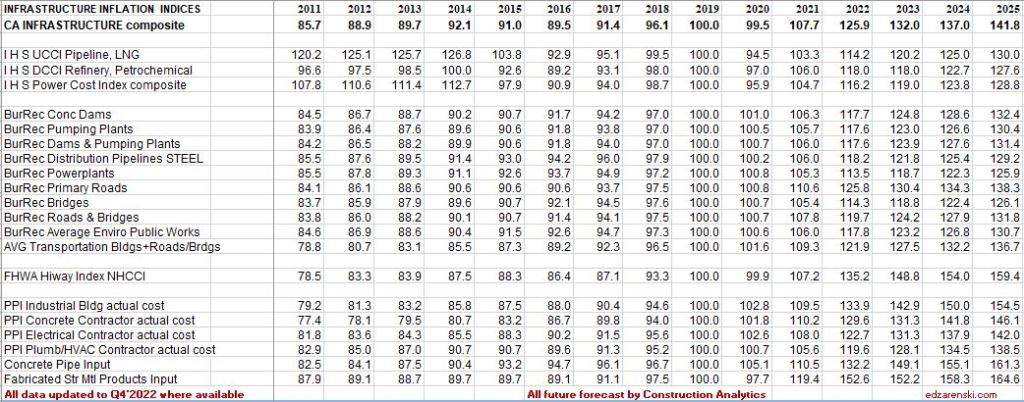
Previous year Construction Inflation 2023 – last updated 12-15-23
Links to Data Sources Construction Inflation >>> Links