Term:Gantt Chart

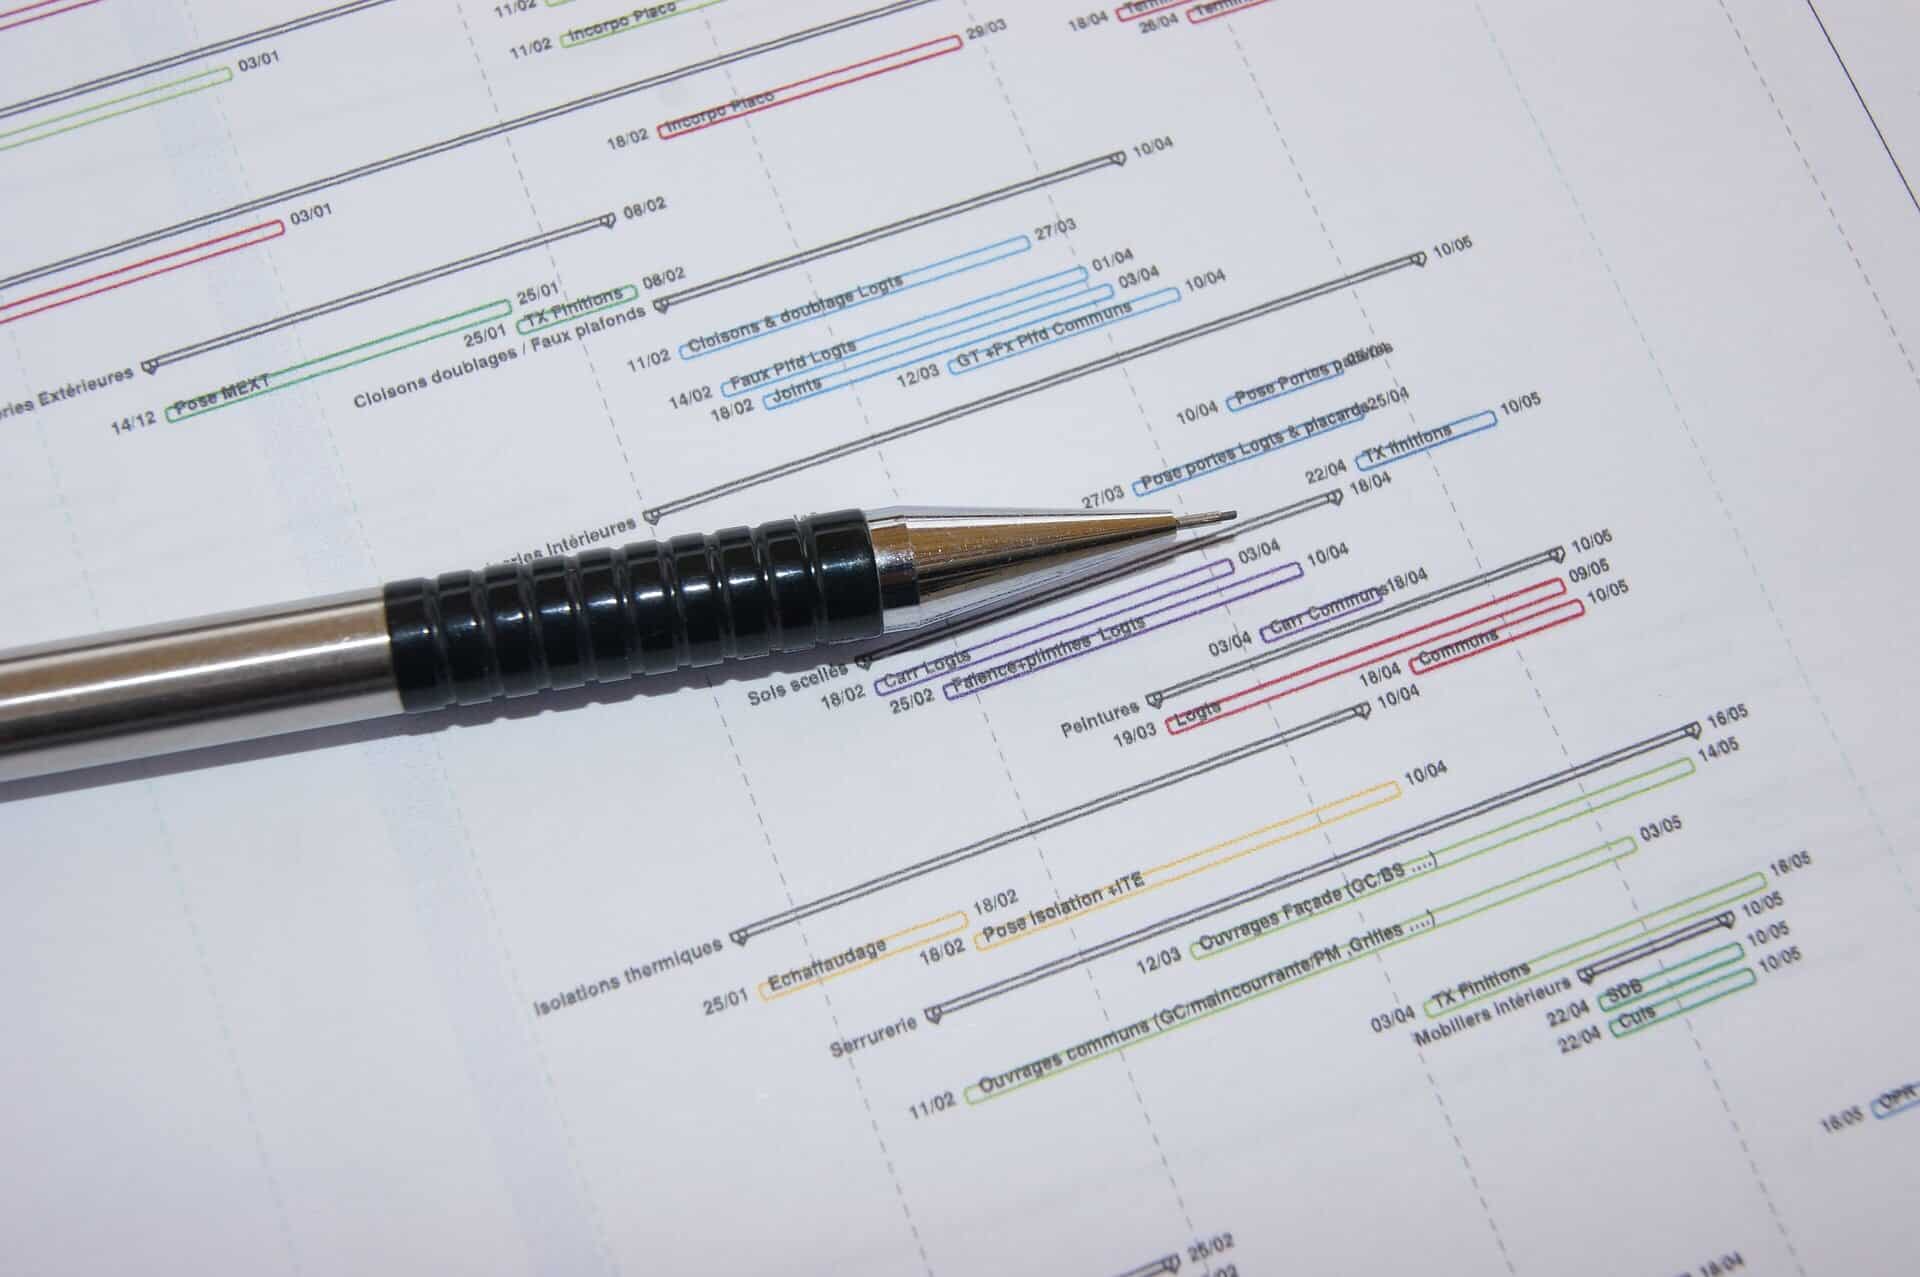
You know those weird bar charts you always see someone bring out in a meeting? A gantt chart is just a fancy name for it. Ultimately a gantt chart is the default display for most schedules and scheduling software such as Microsoft Project or Primavera. A few basic notes: the gantt chart lists the project activities along the Y-Axis. Along the X-Axis is the project timeline (by day, month, quarter, year etc). The bars that are displayed represent the duration of a given activity.
Categories: Division 01 - General Requirements
« Back to Glossary Index