
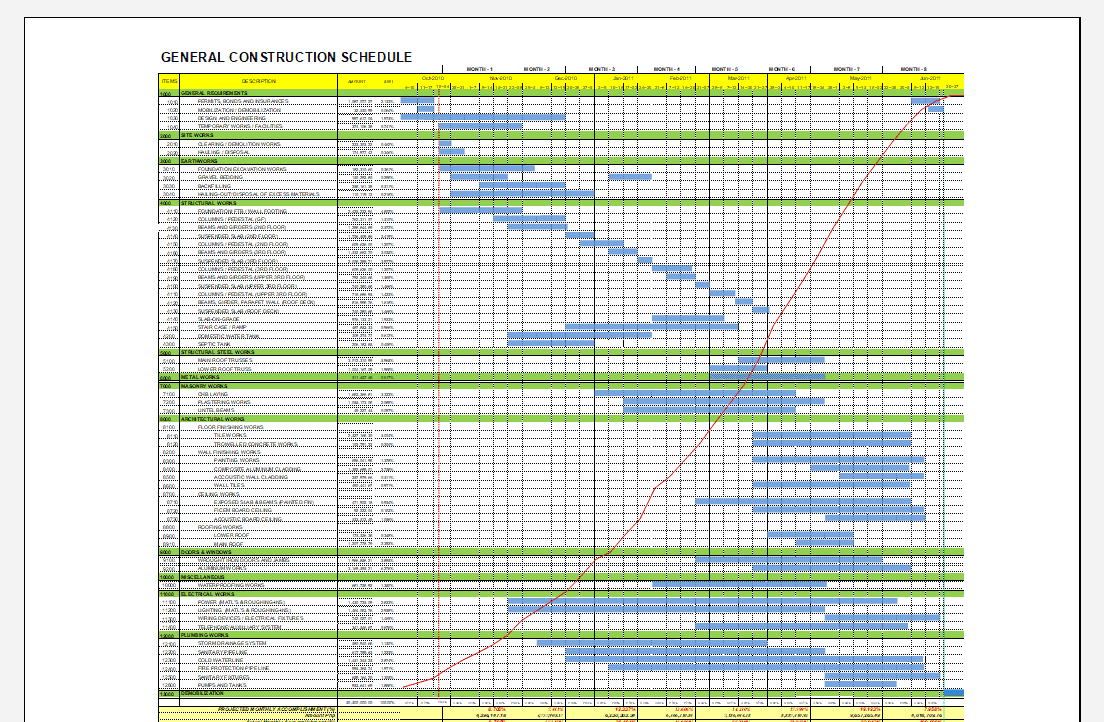
General Construction Schedule (With S-Curve)
$6.99
Download this editable Excel Program for General Construction Schedule
Templates are starting points. Adapt them to your contract and to the laws and safety rules where you work. They are not legal advice.
Product FAQ
You will receive your documents and files immediately after you complete the checkout process. You will receive a link on the checkout page as well as via email.
As long as the document remains on Essential Construction you will be able to download it once purchased.
Yes, in most cases (with the exception of stock photography and ebooks) the files you will receive are editable.
We accept debit, all credit cards (Visa, Amex Mastercard etc) as well as payments via Apple Pay, Google Pay and Paypal.
Our return policy varies based on the product, for more information you can find our detailed return policy here.
Our documents are for use on your projects. You may not resell these documents on other marketplaces.
Full Description
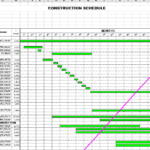
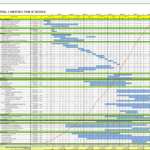
This general construction schedule with S-curve is an editable Excel schedule that also works as a cash flow generator. Enter your activities and their values, and the spreadsheet plots an S-curve over the schedule so you can see the cash flow and manpower requirements of the project.
What is an S-curve in a construction schedule?
An S-curve is a graph of cumulative cost, work or hours against time. On a construction schedule it is drawn over the bar chart and usually shows cumulative value as a percentage of the contract. It is shaped like an S because spending starts slowly during mobilization, rises steeply during the main construction phase and flattens out during finishes and closeout. Comparing the planned curve with actual progress shows whether a project is ahead or behind.
When to use it
- Preparing a baseline schedule and cash flow forecast for a tender or contract.
- Showing the owner or lender the expected payment profile.
- Monthly progress reporting, by plotting actual progress against the planned curve.
- Checking that the work is spread realistically, without an unachievable peak.
- Planning manpower and resources against the value of work in each period.
What’s included
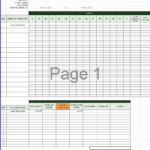
- An editable general construction schedule in Excel.
- A name, duration, start date and end date for each activity.
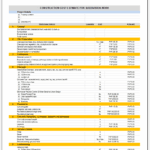
- A value for each activity.
- A cash flow curve output directly over the top of the schedule.
Because it is a spreadsheet, you can add activities, change durations and values, and the curve updates with your schedule.
How to fill it out
- List the project activities in sequence, from mobilization to closeout.
- Enter a duration, start date and end date for each activity.
- Assign a value to each activity so the values add up to the contract sum.
- Review the bar chart to check the logic and timing look right.
- Check the S-curve for a realistic shape and adjust timing if the peak is too steep.
- Save the result as your baseline, then compare actual progress each month.
Tips
- Spread value by when the work is done, not when materials are ordered, unless your contract pays for stored materials.
- Keep a copy of the baseline before you update progress.
- A curve that rises too steeply at the start usually means front-loaded values.
Related templates and guides
- S-curve and Bar Chart
- S curve Creator for Any Start and Finish Dates
- Construction Cash Flow Forecast
- Glossary: Gantt Chart
- Guide: Fundamentals of Construction Scheduling
Frequently asked questions
What is the purpose of the S-curve in construction?
It shows how cost, work or hours are expected to build up over the life of a project. Owners use it to plan funding, contractors use it to forecast cash flow and resources, and both use it to track progress by comparing actual results against the planned curve.
How do you create an S-curve in Excel?
Set out the activities with their dates and values, spread each value across the periods in which the work happens, total the value for each period and calculate the running cumulative total. Convert it to a percentage of the total value and plot it as a line chart.
Why is the curve S-shaped?
Work starts slowly while the site is set up and early trades mobilize, speeds up when most trades are working at once, then slows again during finishes, commissioning and closeout. That slow, fast, slow pattern produces the S shape on a cumulative graph.
What does it mean if actual progress is below the S-curve?
If the actual curve sits below the planned curve, less work or value has been completed than planned, so the project is likely behind schedule. Look at which activities are late and update the forecast. A curve above the plan can mean the project is ahead or that billing is front-loaded.
What are three common types of construction schedules?
Common types are bar charts or Gantt charts, which show activities against time; critical path method schedules, which show the logic between activities and the longest path; and short-term look-ahead schedules used by site teams to plan the next few weeks.


rendimulyadi@icloud.com –
100